
Purpose of this page
This is a continuously updated page and it is never finished! I decided to go ahead and cover the tools I typically use for analyzing malware because although I’ve found lists elsewhere, I’ve found no real big collection with explanation and/or any type of discussion of these tools. It’s generally more like “here’s a big list of 100 malware tools, have fun!” like they typically have on those giant compound lists on Github. If that’s all you’re looking for, well, you got it. However, I wanted to add some more value by actually describing some typical usages and workflow with the tools, as well as provide some screenshots to show exactly what these tools are used for and how I use them.
Before starting, I want to emphasize that I currently engage in Windows malware analysis. This doesn’t mean that I won’t introduce Linux tools. What this means is that most of the tools are used for analyzing Windows files. Static analysis of Windows files can actually be done in a Linux environment and in some cases, the tools are more powerful from Linux, and analyzing Windows execs on Linux is also the safest option if you’re worried about accidentally running the malware for some reason.
The Approach – IMPORTANT!
It’s important to understand how I will be presenting the tools. What I’m going to do is present them in order of usefulness/how frequently I use the tool in each subcategory. It’s important to note that this does not mean one is “better” than the other. There is no “best” here, however, there is “more frequently used for analyzing malware samples all day.” I’m also aiming to introduce an assortment of tools here rather than introducing 5 tools which all serve the same or very similar purposes. Last but not least, I cannot possibly explain every feature of all of these programs so instead, I’m going to explain how I use each program. This means, if a program has 1,000 features, but in my daily analysis, I only use 5 of them, I’m only going to cover those 5 because I’m not going to explain features I’ve never used. However, you will still find the information useful because the features that I use are most likely the most beneficial features of the tools for malware analysis. If you have any tools you’d like to suggest, links, or any other comments feel free to leave them below.
A Quick Note on Redundancies
To be frank, many of these programs, especially the Portable Executable analysis tools, have overlapping/redundant features. However, each particular program has something unique about it that makes it useful in its own right. I wanted to mention this so you didn’t think I was going insane by writing about 3 different programs that all display the PE Optional Header and DOS Header data structures. Okay, here we go!
Basic Static Analysis Tools
PE Studio
https://www.winitor.com/
remnux alternatives: peframe, exescan.py
Purpose – Gathering initial clues about a suspect file as well as making quick assessments.
PE Studio is a great starting place for analyzing a malware file. This is a static analysis tool which scans the file and creates nice, organized lists out of the file’s header information. We get tabs for:
- Hashes – The file’s md5, SHA-1, and SHA-256 hashes.
- Virustotal – PES automatically submits the file’s hash to VirusTotal by default, and lists the results in this tab.
- DOS-STUB – This section displays the PE/DOS file’s DOS Stub, which is the section between the MZ and the PE header and often says “This file requires Windows to run” or something to that effect, in case the user was ever running the file on an old DOS system.
- File-Header – General info about the file’s header such as where the signature is located, the targeted CPU architecture, 32 or 64 bit, size of optional header, and compiler stamp.
- Directories – Relative Virtual Address location and size of each
- Sections – Very useful for malicious files because they often will have extra, strangely named, or suspicious sections. PE Studio will attempt to detect this and does a pretty good job in my experience; it will change the text color of a suspicious section to red.
- Libraries – The DLL files that the program references in the file being analyzed. This is very similar to the function imports, except, it gives you a list of the files where the imports are being called from.
- Imports – Probably the second most useful tab in PE Studio – This is the list of all OS/Win32 API calls that the program uses. This can easily give away the program’s capability and make its intentions fairly clear. For example, if it’s using GetKeyStateAsync, WriteFile, and some winsock calls like socket, connect, send, then there’s a good chance that it may be a keylogging program. On unpacked files, the imports section is usually pretty populated so there are a lot of clues there.
- Exports – These are functions that the PE file exports for other PE files to use. Many times there is only one export (start) but you will see higher numbers of exports if the file is a DLL file meant to be used by other files.
- Resources – Another very useful field in locating malware. Even the most advanced malware will typically have executable resources attached which will be marked red and very obvious here. When I see this, I immediately raise red flags and then open the file in Resource Hacker which I will introduce later in this article.
- Strings – IMO, still the most helpful part of any basic static analysis. This section simply runs strings on the file and then parses each string into a nice and sortable list. It also checks each string with a dictionary of blacklisted strings and will alert strings which it feels are suspicious or indicative of malware.
- Debug, manifest, version, certificate, and overlay – These are all small meta-data sections that can be used to aid in your analysis. Many times, there are no significant clues here, or there are clues which are insignificant alone but combined with suspicions gathered elsewhere, may aid in your investigation. For example, if you find that the file otherwise looks like a legit Microsoft Windows file so far, but it suddenly has a John Deere certificate and version info to SoftwareWerkz, that is definitely a red flag.
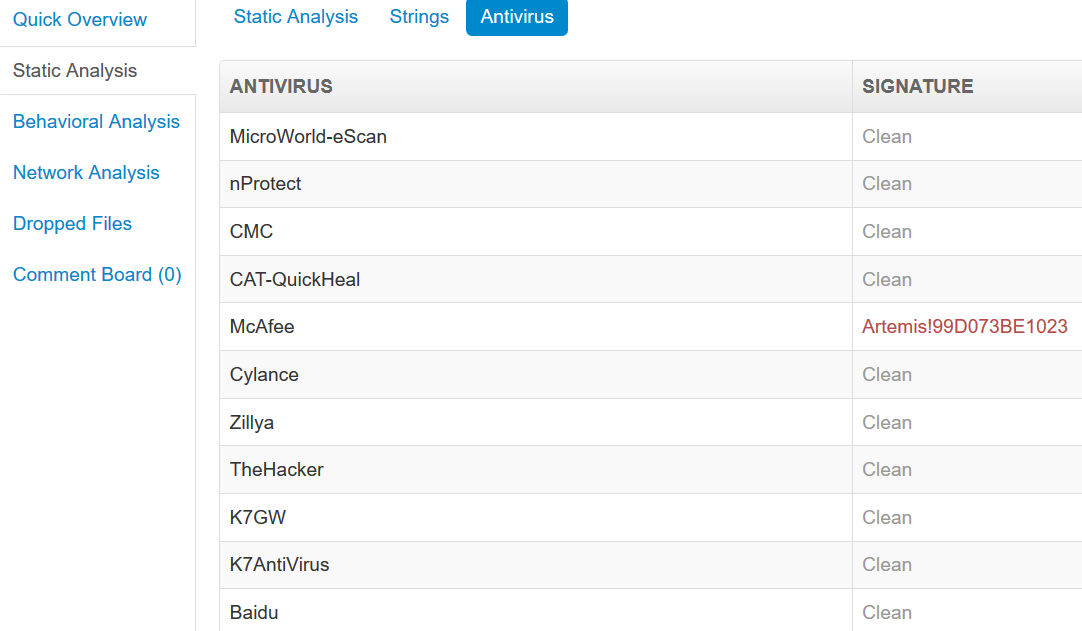
Highlights
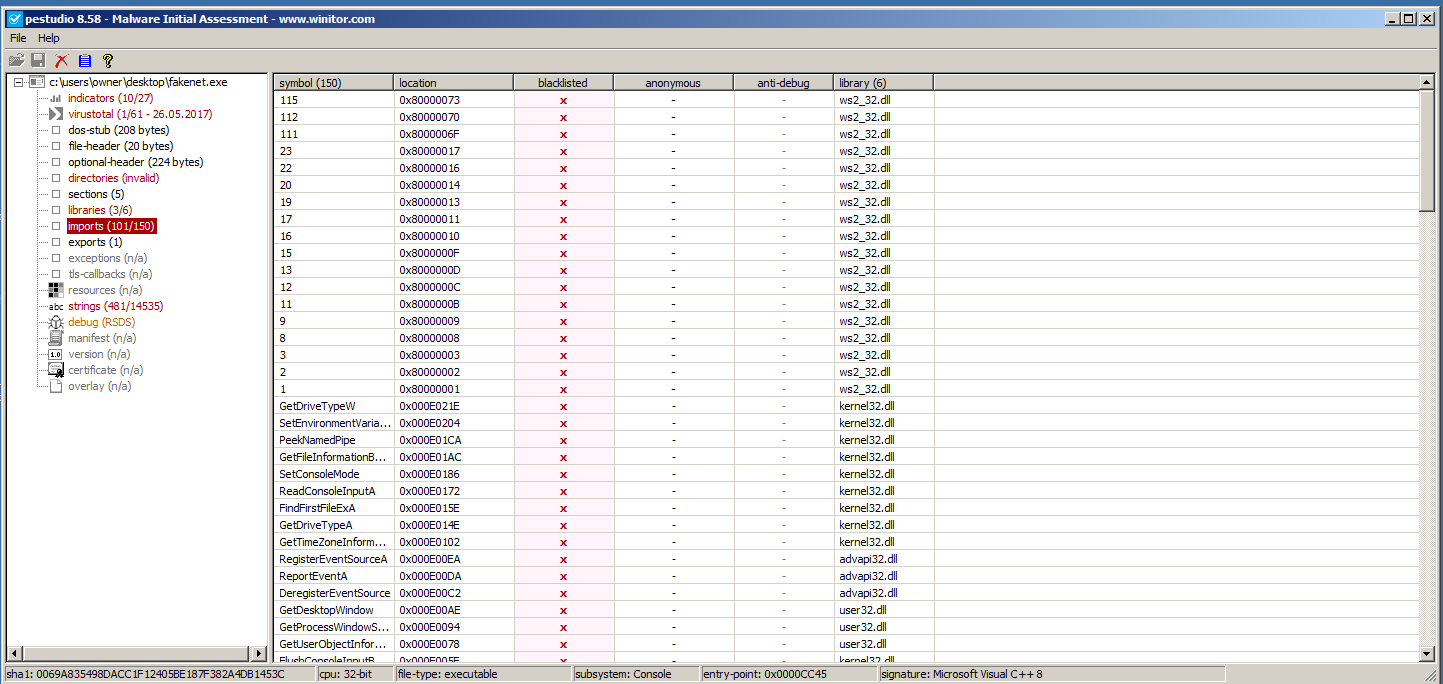
One thing nice about PE Studio is throughout its report, it will highlight in red anything that it finds suspicious in an attempt to draw your attention. This could be VirusTotal hits, suspicious strings, imports, resources, etc… However, please note that it highlights a lot of false positives. This is because a lot of legitimate programs use the same functions and imports DLLs as malware programs do. This is why in order to properly classify malware with high accuracy, it still takes a human and his/her intuition, as well as the totality of circumstances measured with all tools used. For example, this screenshot is a PE Studio readout of a totally legitimate file. In fact, it’s another malware analysis tool called FakeNet. Look at how many red flags it raises:
PE Studio is a great place to start on a basic initial static analysis of a suspect file. Now, let’s move on to Resource Hacker.
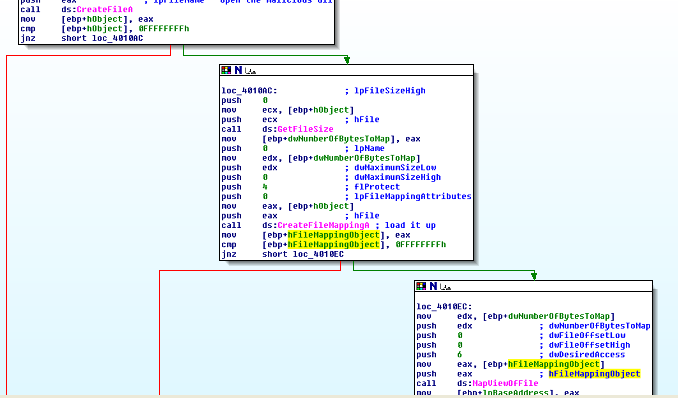
Resource Hacker
http://www.angusj.com/resourcehacker/
WanaCry’s attached executable resource
Purpose – Examining data attached to portable executable files in the resource (.rsrc) section. This tool is often handy to use after another tool such as PE Studio has identified suspicious resources.
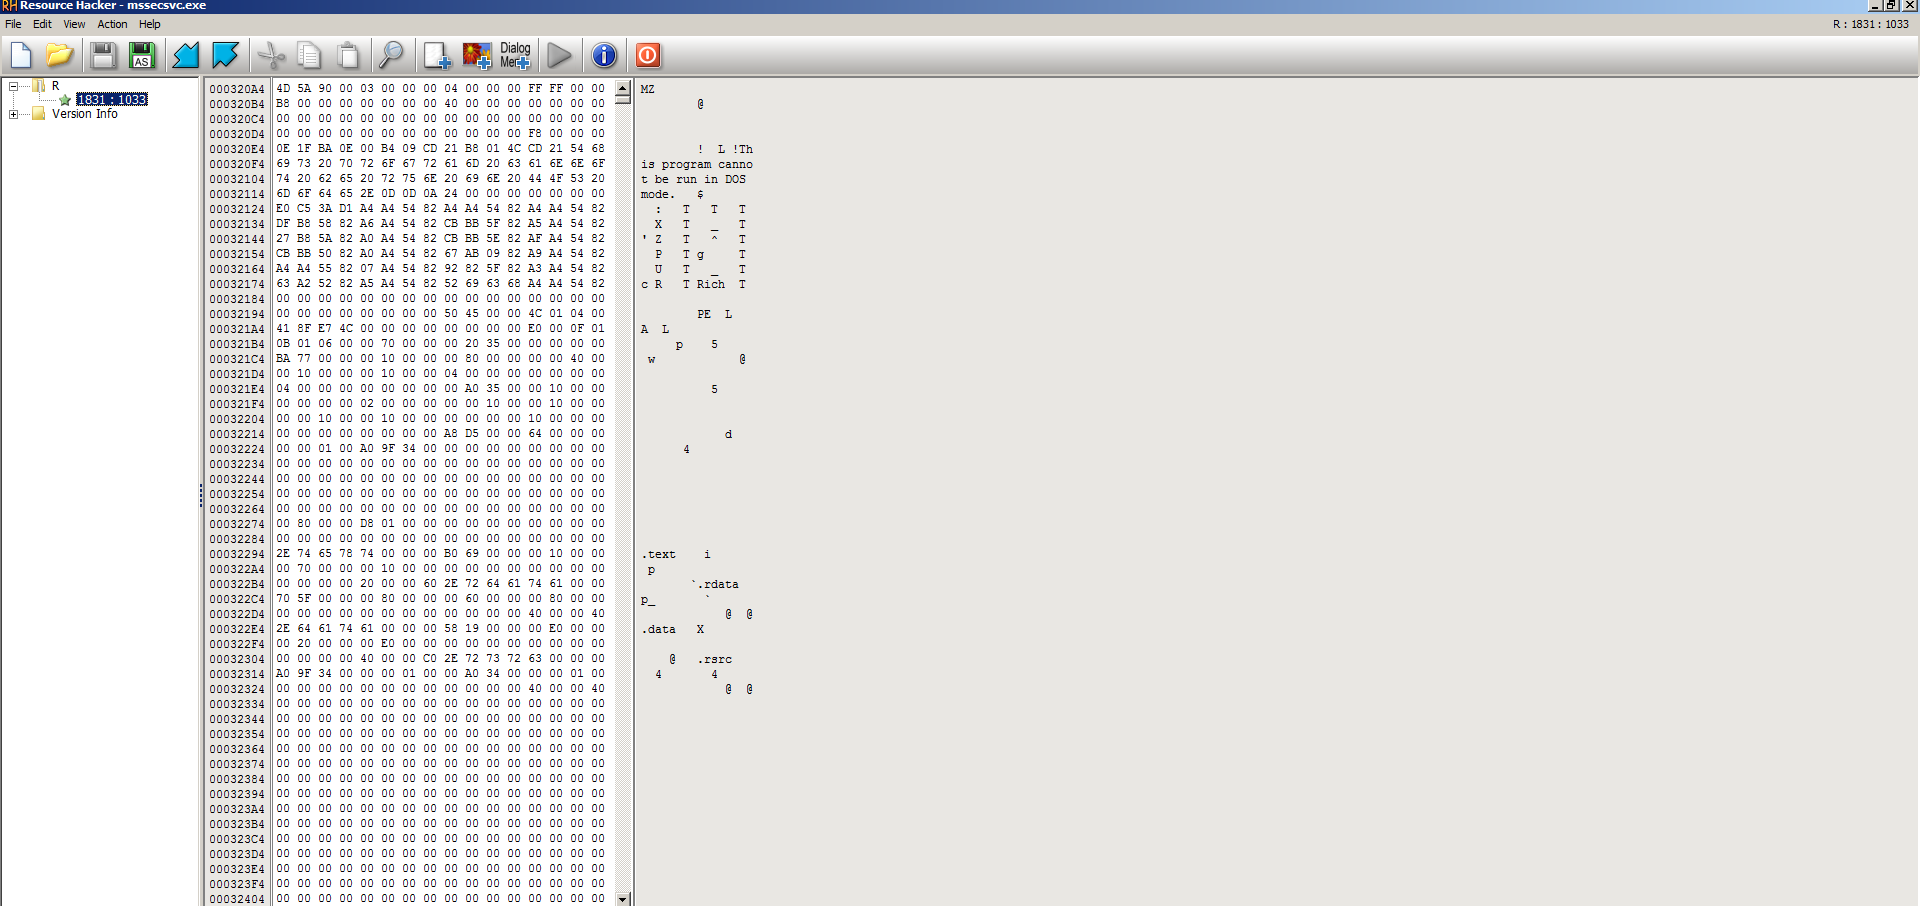
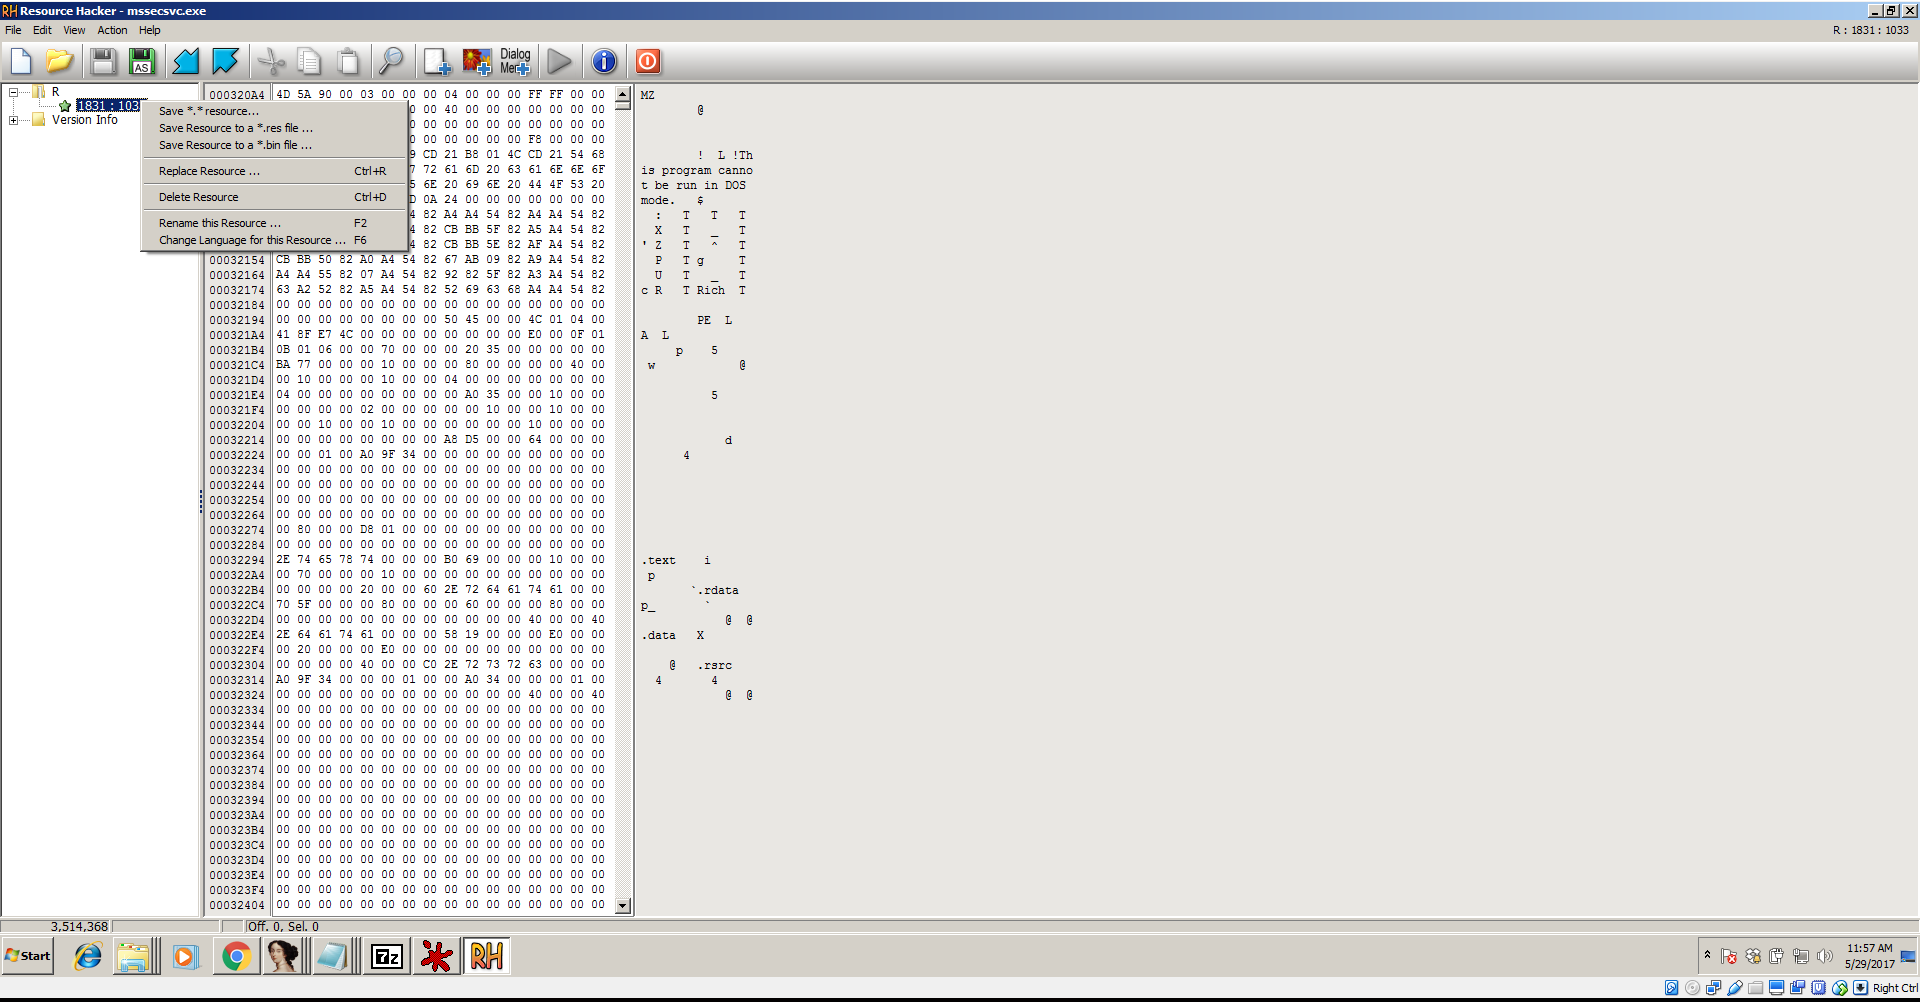
Resource Hacker will display binary/hex/plaintext for any relevant attached resources. If the resource is an image, it will also display the image. One of the most useful features of Resource Hacker is that it will allow you to right-click a resource and dump it out to its own individual file. A lot of malware will attach an executable PE file as a resource on another PE file and then it will unload that resource into it’s own file before running it on a victim machine. Another common usage of resources is to simply encrypt data and place ciphertext as binary or even plaintext data in an attached resource. What you will then find is code to decrypt this ciphertext somewhere in the malware’s disassembly. Resource Hacker allows you to manually unload the resource and then, for example, run the resource in an analysis tool such as PE Studio or IDA Pro to examine it.
The below screenshot shows how easy it is to export a resource as a file in Resource Hacker:
As you can see, Resource Hacker comes with its own hex viewer, but I prefer HxD, WinHex, and Hiew for hex editing and viewing.
HxD Hex Viewer/Editor
https://mh-nexus.de/en/hxd/
remnux alternative: wxHexEditor
Purpose: Viewing the hex machine code of a binary file in order to examine the file’s format, data, strings, and other useful information
Essentially, all of the other tools are sifting through what you will see manually in HxD or another hex editor and trying to make sense of it and/or present the data in a nice way. HxD presents it as raw as you will get without staring at zillions of 1s and 0s which would be fundamentally useless. Viewing straight hex is an acquired taste and may be scary to new analysts, however, you’d be surprised at how easily you can scoop up clues on a binary file from a cursory scroll through the file in HxD. Very surprised. There are several usages for which HxD excels:
- When other tools fail. HxD just displays raw binary data and therefore, it cannot “fail.” It is not attempting to parse any data structures like PE Studio, PEinfo, IDA Pro, etc… Those programs are taking the data and trying to make sense of it, but they can be confused or thwarted by anti-analysis techniques such as packing/compression. HxD cannot because it is not interpreting anything, it’s just showing it to you.
- When you need to edit the data without anything in the way. You can be analyzing a file in another program like IDA Pro and realize that you want to change some assembly instructions. You can do this by searching for the address in HxD and changing the bytes there manually, then saving the file.
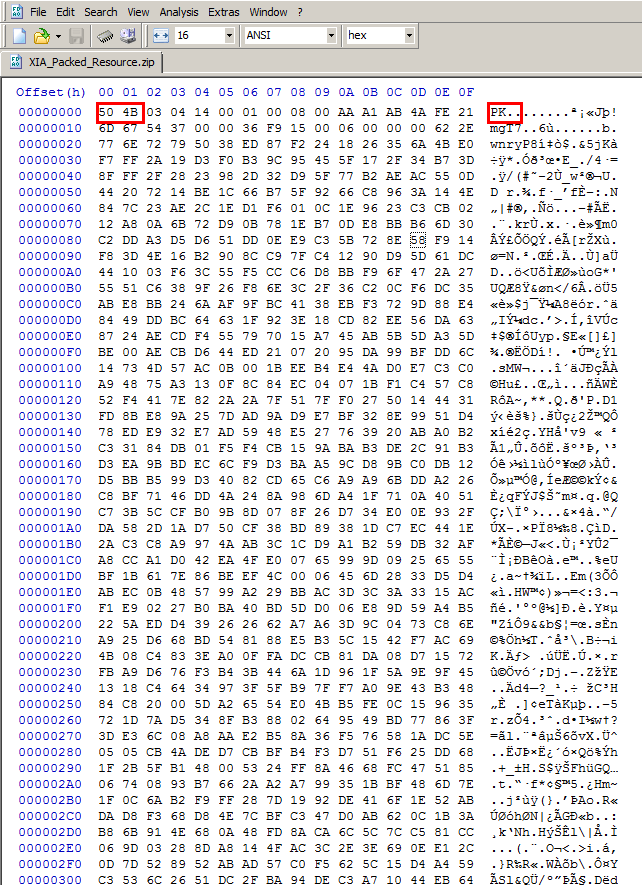
- To identify file format information. There are a zillion ways that for whatever reason, can stop the Windows loader or other malware analysis tools from executing/opening a file. Examining the file in HxD can show you whether the file is even a proper PE file at all and give you clues as to why it won’t open. Most file formats will have constants that identify them. For example, files packed with the popular UPX packer will have “UPX” clearly marked in the file, ZIP Files, which are actually PKZIP, will have the bytes “50 4B” which are the ascii letters “PK” at the very start of the file instead of the MZ in a PE file…. See below:
It turns out, many compression, encryption types, and general file format info can be detected in a similar fashion using HxD. Actually, any hex editor should do but HxD I’ve found to be the fastest for a cursory run-through. One neat feature of HxD is that it can also open up, view, and dump RAM. For that, you go to the Extras menu and then click Open RAM. This feature is very useful for malware that is packed/encrypted because you can wait for the malware to unpack or decrypt itself while it’s loaded in memory, then Open RAM and dump it to a file. Now you can open the file in a malware analysis tool for further examination.I typically just use HxD for viewing hex. If I want to do any serious editing, I head over to WinHex or 010 Editor (covered below) because it has a more powerful and versatile feature-set for editing files, but HxD has the capability of editing as well and is a little simpler to use. I will not be covering WinHex in detail here because it is very similar to what I’ve already described about HxD with just a few added features. I will cover 010 because it has some very distinct features.
Similar programs: Hacker’s View (Hiew), WinHex, 010 Editor
010 Editor
https://www.sweetscape.com/010editor/
Purpose: General hex editing and parsing data structures into a more legible format.
010 Editor can do everything HxD can and more. It has many more features such as a nicer user interface with custom themes, and my favorite feature of all hex editors – Binary Templates. These templates allow you to view the bytes both in the raw hex window and in a data-structure format. This is extremely useful because usually, analysts are limited to having to either view the data programmatically in a data structure or completely in the raw in a hex editor like HxD and have to manually try and figure out which bytes correspond to each C data structure, for example.
With 010 Editor’s Binary Templates, this is resolved. The templates follow standard formatting conventions and use that information to parse the bytes into the data structures for presentation to you, the user for viewing and modification. The only requirement is you download (or create if you want) the template for whichever file type you desire. For example, there are templates for Windows Portable Executables and Linux ELF files. Check out the below screenshot to see the templating in action:
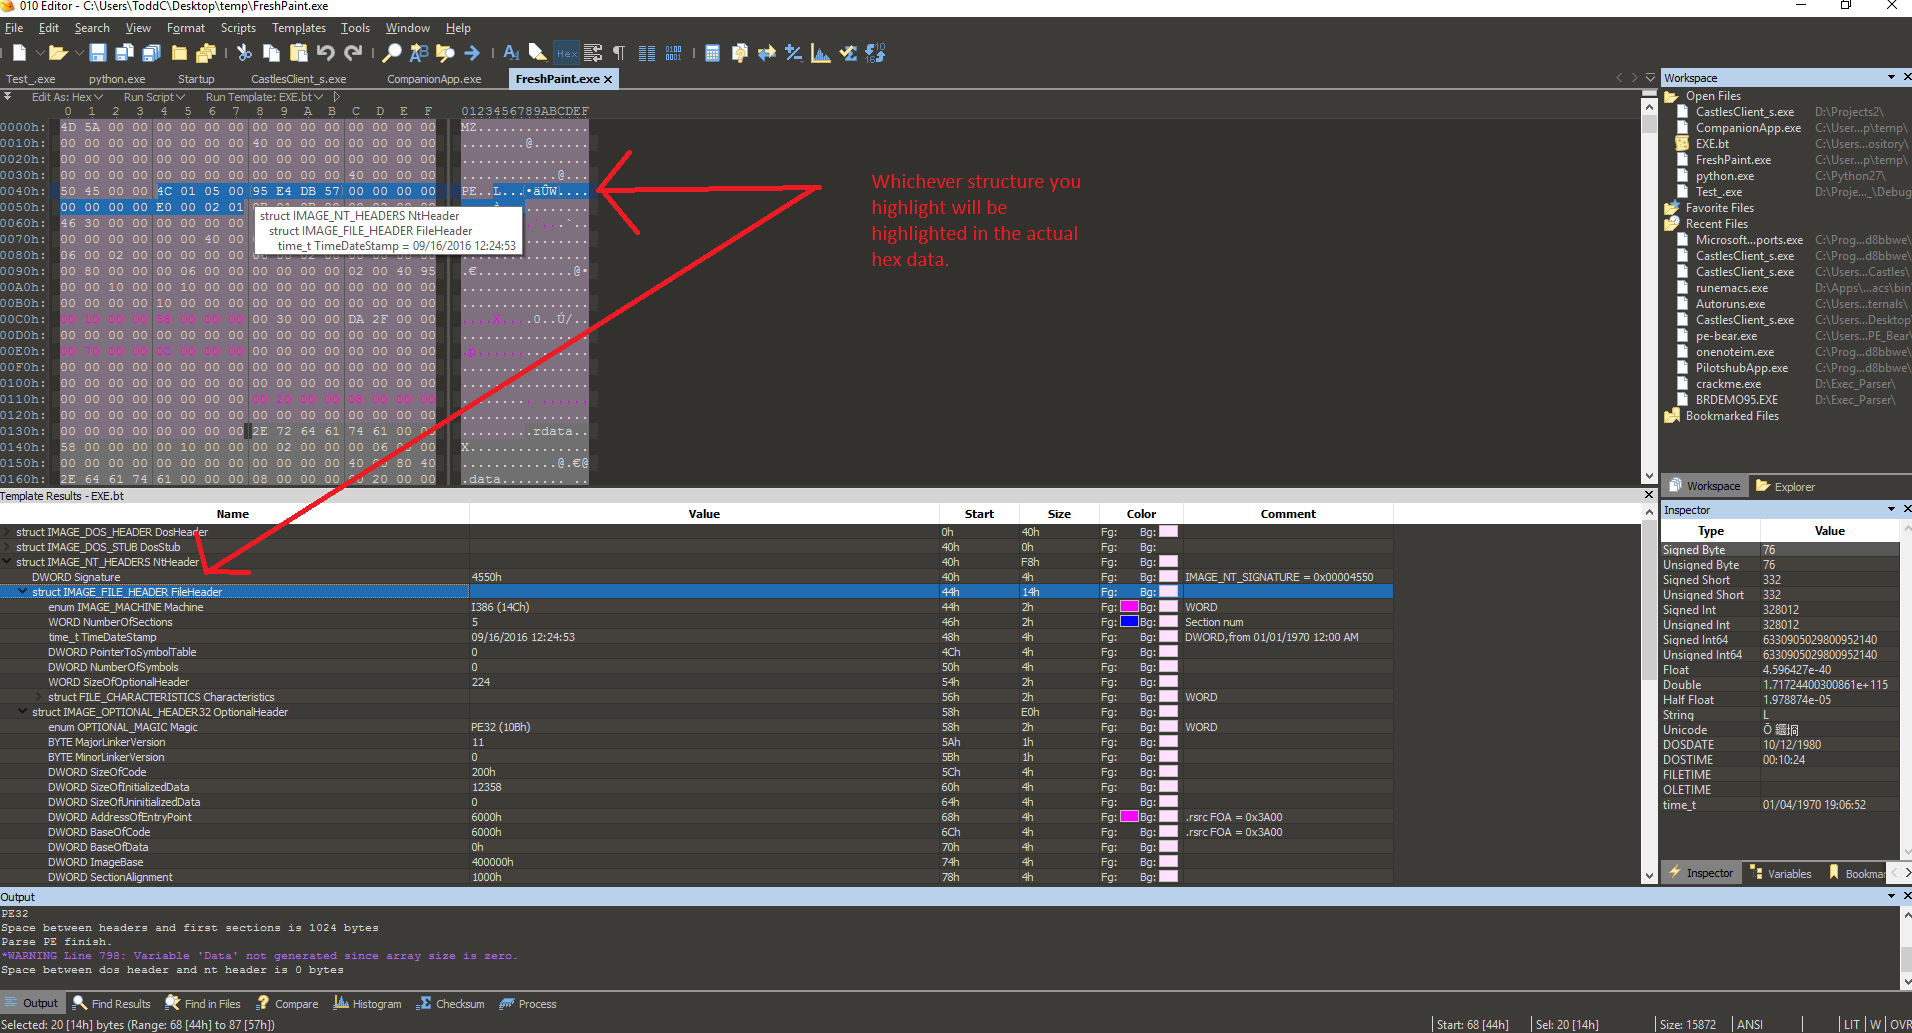
You will also notice the color-coded highlighting in real-time where 010 editor will show exactly where the data from a struct is in the raw hex. This is super useful, for example, when an analyst is trying to locate the PE signature, DllCharacteristics, Import Address Table symbols, or literally any part of the PE file data structures. Remember, templates are also available for many other binary formats such as JPEG. You may also create your own template, which is easy to do if you are familiar with C syntax. 010 Editor is also scriptable in this way.
Last but not least, I want to point out the value of 010 Editor for tool development. If you want to build a tool, for example in Python or C, to aid in the analysis of a PE or ELF file, having these binary templates makes development and experimentation a breeze versus having to manually count the sizes of all of the structures in a non-visual way. It also makes side-by-side comparisons between files very easy to do. This is by far my favorite hex editor but it is also not free. It is around $50 for a non-commercial license and more for a commercial one. It is well worth this price. That all said, I still prefer HxD for cursory file checks, as it is much faster and lighter.
DIE – Detect it Easy
http://ntinfo.biz/
remnux alternative: packerid
Purpose: Detecting packers, Compilers/Linkers, and encryption.
DIE is like an updated version of PEiD which I will mention in this article. PEiD is definitely more widely recognized, but DIE has a higher detection rate for me as far as packer identification is concerned. DIE also has a nice, sleek interface and entropy graph. In addition, it, like many other analysis tools, supports plugins and there are some plugins which are useful for unpacking and encryption detection. However, I mainly use DIE to identify packing and compiler/linker information. You simply download the program, extract it, then drag a PE file onto it and you get:
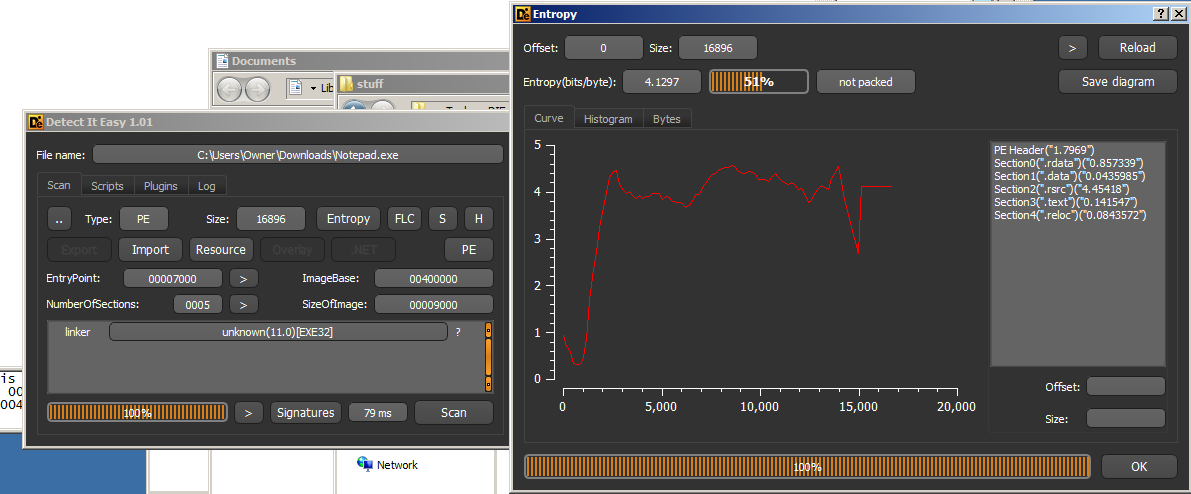
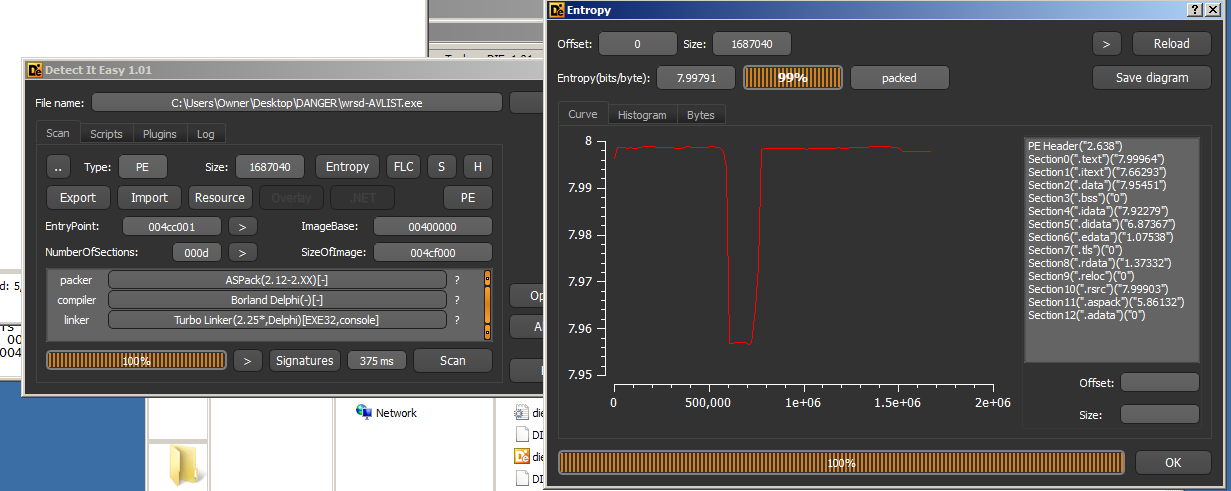
This is the extent to which I currently use DIE, even though it is definitely capable of more.
Other tools which are similar: PEid, Protection_ID, RDG Packer Detector
PortEx Analyzer
https://github.com/katjahahn/PortEx
Purpose:
PortEx Analyzer is useful for three main reasons:
-
- It creates a nice plaintext logfile of basically all of the information provided by the typical PE analyzing tools like imports, exports, hashes, file info, manifest, headers, etc…
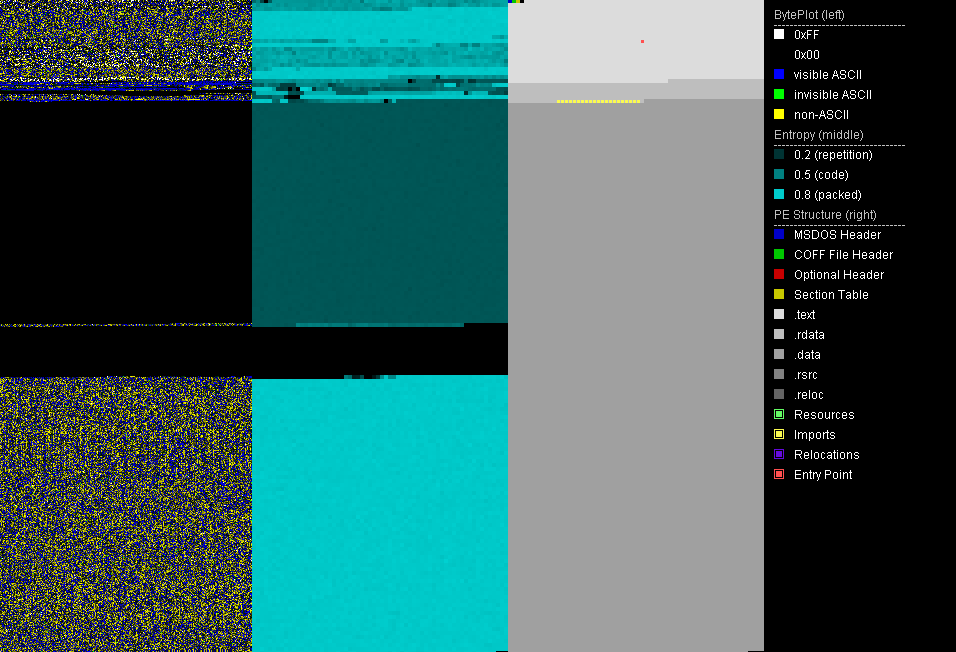
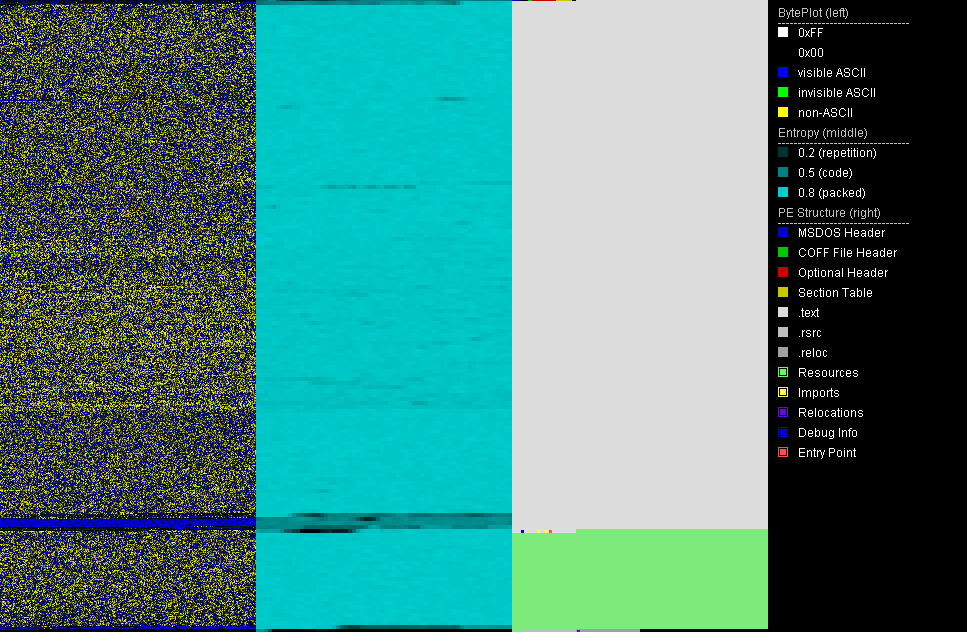
- It can create an image visualization of the file’s data, which shows entropy and can easily display if a file is packed and where specifically is is packed.
- It very well-documented. In fact, it’s one of the most thoroughly documented open-source projects that I’ve ever seen which doesn’t have a major corporate backing. Very well done, Karsten Hahn.
PortEx Analyzer also has some abilities to diff files (highlight differences in them). However, the flagship usage of this program is the unique data visualization image, called the “BytePlot.” Below are two examples of this BytePlot. The first is a standard unpacked portable executable file, the second is a file packed with ASPack:
Here is a screenshot of a portion of the logfile created by PortEx Analyzer:
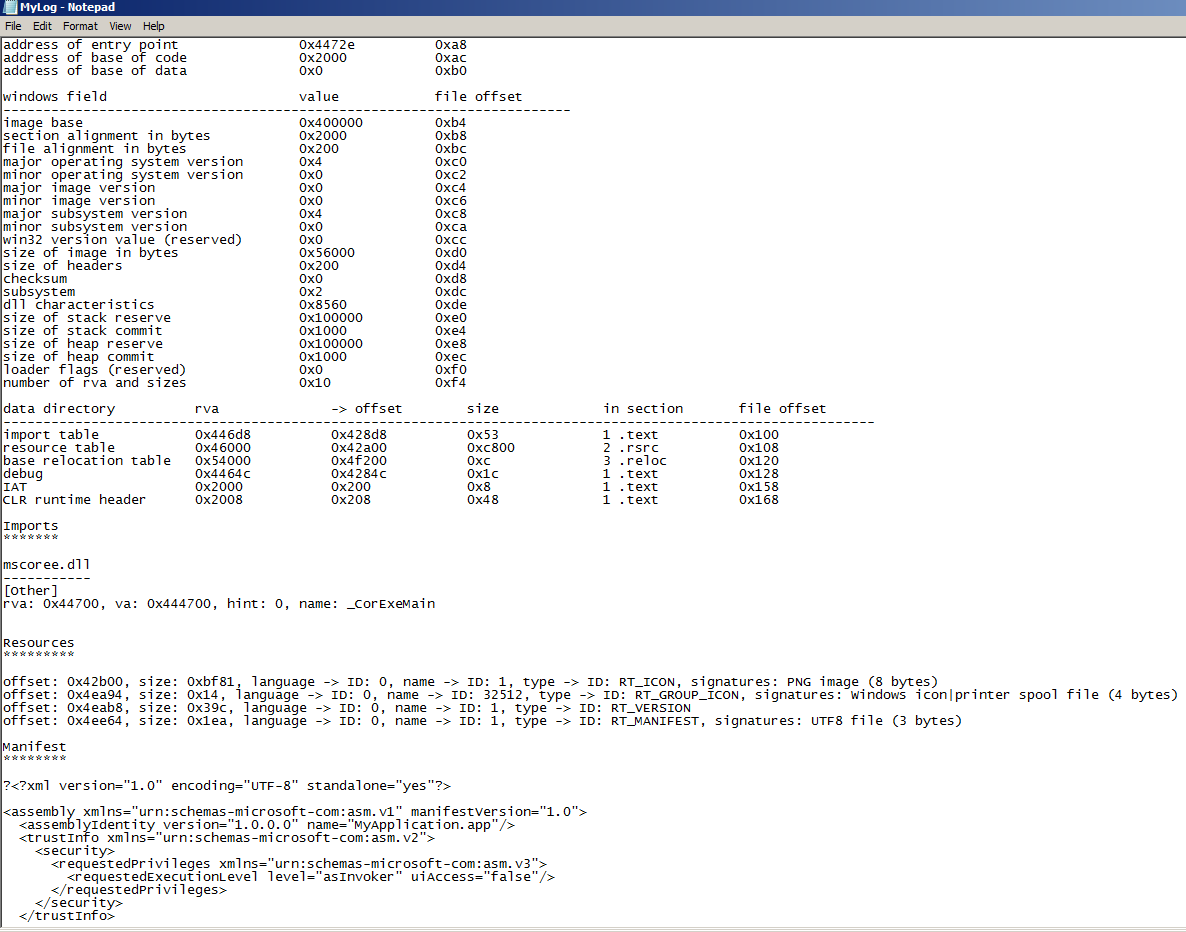
To get started with PortexAnalyzer, just go to the repo link at the beginning of this section, make sure you have Java installed, download the big ~11MB JAR file from the GitHub, open a command prompt, navigate to the jar file, place a sample PE file in the same directory, then use:
C:\Users\You\Desktop>java -jar portexanalyzer.jar -o MyLog.txt -p BytePlot.png sample.exe
This command will analyze the file entitled sample.exe which is in the same directory, log the results to MyLog.txt and then proceed to create a .png image of the file’s bytes, called BytePlot.png here, so that you can view the entropy and other info as seen above. Note that you are not required to create a BytePlot and if you do not specify a log file, PortEx Analyzer will print the info into the console.
Other Portable Executable (PE) File Analysis Tools
As aforementioned in the intro, there are actually a surprisingly large number of Windows Portable Executable file analysis tools out there. Many of these tools to basically the same thing but have a couple of specific advantages. In this section, I’m going to very quickly go over each one and if you want to learn more, feel free to try them yourself.
PE Explorer
http://heaventools.com/overview.htm
Purpose: Examine PE files similar to other tools but also can unpack PE files which are packed with basic UPX, UPack, and NsPack plus it has a “safe mode” to open even corrupted PE files.
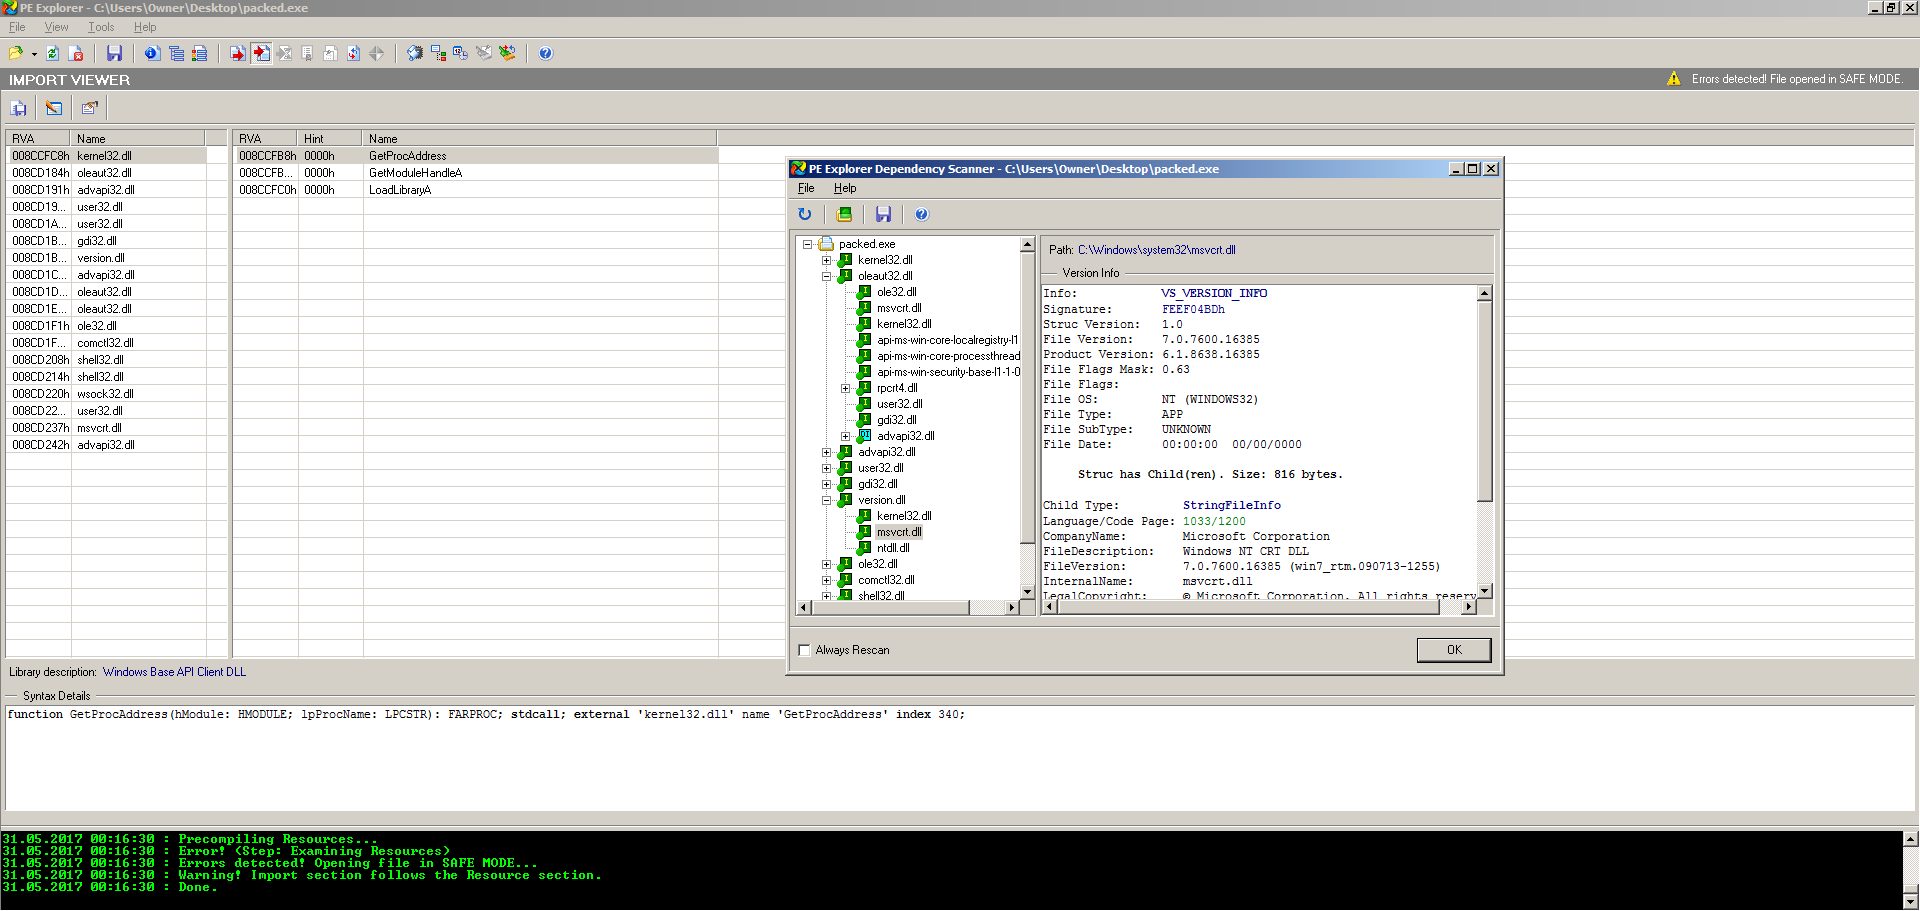
PE Explorer is by far the most comprehensive and solid of these tools. Like PortEx Analyzer, it is also very well documented and has plenty of help files. Many of the other tools will crash or not function properly when a PE file is severely obstructed, corrupted, or packed. As an analyst dealing with Windows files all day every day, I run into a ton of files which fit this bill. Luckily PE Explorer has something that the developers call safe mode in which when the analyst feeds it a corrupted, obstructed, or packed file that it does not recognize, it will not crash. Instead, it will still open the file and attempt to make sense of it, offering a more limited feature set.
PE Explorer also ships with something called a Dependency Scanner, which walks all of the imports and then attempts to resolve all of their dependencies and then presents meta information on these dependencies to the analyst. You can see an example of this in action in the above screenshot of the program, as well as the Safe Mode functionality.
Last but not least, PE Explorer comes standard-issue with 3 unpacking plugins: UPX, NsPack and UPack. If a file is packed with any of these packers, PE Explorer will attempt to unpack it automatically when you open the file. PE Explorer also comes with a pretty basic disassembler, and a resource viewer and editor. PE Explorer allows you to edit and save a file. However, PE Explorer is also not free but there is a 30-day free trial offered.
Professional PE Explorer (aka puppy)
https://www.mzrst.com/
PPEE is similar to the other PE tools but it has a few distinct differences that warrant it to be in its own section. This tool seems to be a cross between PEInfo and PE Studio in that it has the “raw” presentation of data structures similar to PEInfo but a nicer look and feel like PE Studio. When I say raw presentation of the data structures, for example, PPEE parses the data as e_lfanew and DIRECTORY_ENTRY_IMPORT rather than sugarcoating the naming. This comes in handy if you need to actually do tool development work using these PE data structures because you don’t have to go running to MSDN to hunt down the official data structure names. However, the more useful features of this tool include its ability to parse out .NET meta information for any standard .NET files like so:

PPEE shows methods, properties, and other object names as well as their offset addresses
One last feature I love about PPEE is how it handles strings. PPEE separates ASCII from Unicode strings and it also searches specifically for URLs, Registry entries, and “Suspicious” and it separates these all into their own lists. Check out this screenshot of the URLs PPEE located in a sample file:
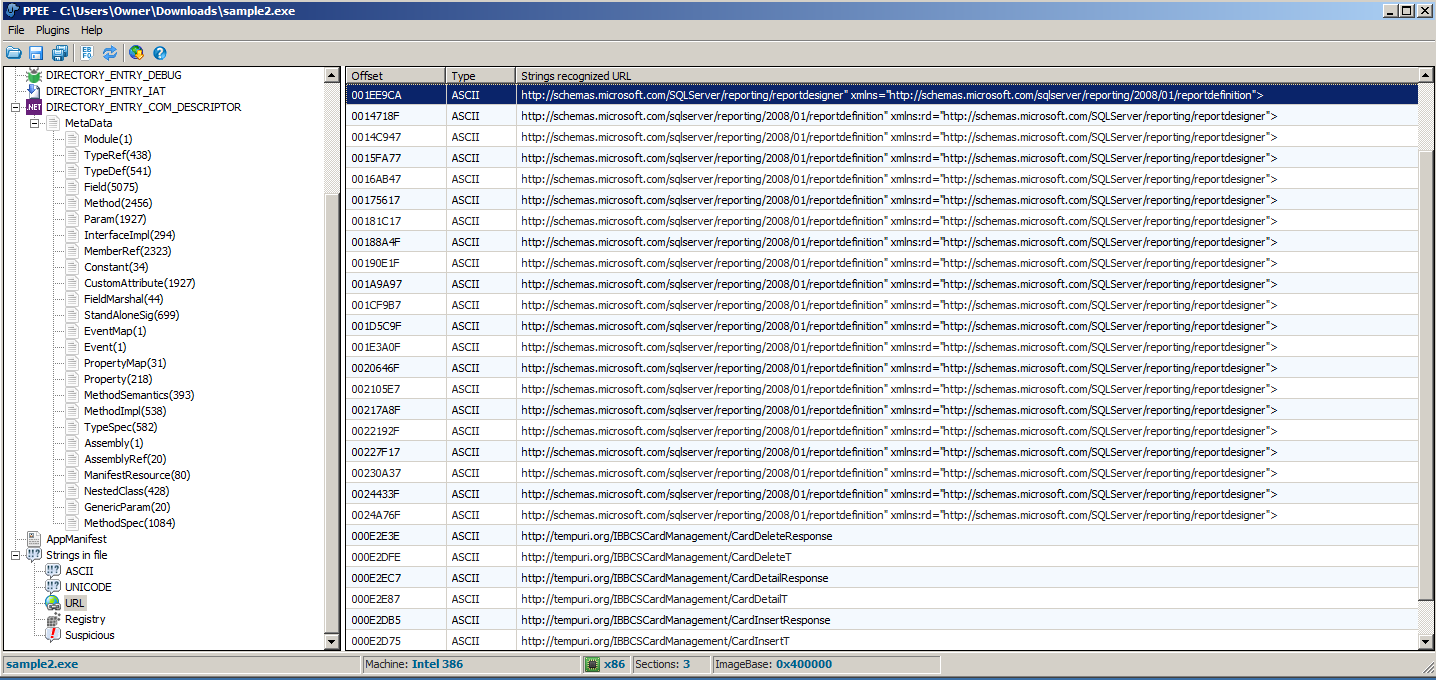
The URL, Registry, and Suspicious can take a few seconds to load because it has to search for the strings but otherwise, it works very well. I also like that unlike other PE analysis tools, PPEE gives you the offset memory address of where it finds each string. This is good for switching between tools such as going to IDA Pro and locating the data in order to cross-reference it in the code. Without this, an analyst has to hope that IDA also locates the string in its strings section or locate it manually in a hex editor. PPEE, like PE Studio and PE Explorer is also being actively worked on which is a plus as well. Just know that you will need the VC++ 2010 Redistributable in order to run PPEE. PPEE has some other useful features; check the official website listed above for more info and screenshots.
PEInfo, CFF Explorer, and PEView
PEInfo – http://www.pazera-software.com/products/peinfo/
CFF Explorer- http://www.ntcore.com/exsuite.php
PEView – http://wjradburn.com/software/
remnux alternatives: pedump, peframe, pescanner, pev, exescan.py
Purpose: Further examination of PE file data structures with associates tools.
All of these programs display very basic and “raw” PE data structures info that can be viewed in PE Explorer and PortEx Analyzer. For this reason, I will not be going into detail about these programs, but they are other options. CFF Explorer also has a Dependency Walker much like PE Explorer’s Dependency Scanner, a built-in hex editor, disassembler, supports 64 bit-files, and supports .NET file features as well.
Advanced Static Analysis
ILSpy and dnSpy .NET Decompilers
http://ilspy.net/
https://github.com/0xd4d/dnspy/releases
Purpose: Turn .NET applications back into C#/.NET code.
If you haven’t done so already, I urge you to grab a .NET program and try and reverse engineer it in IDA Pro and OllyDbg. See you in about 6 months.
Seriously though, it’s a real hassle because the program starts up a “virtual machine” runtime environment, which litters the native command chain such that figuring out exactly what the programmer’s code is and what it is doing becomes exceedingly difficult: Mixed in with his/her code is a zillion function calls from the actual .NET runtime that will have your head spinning fast.
Luckily, none of that is necessary because as you may or may not know, standard .NET programs are not even compiled to native code but rather Common Intermediate Language (CIL), aka Microsoft Intermediate Language (MSIL). This looks much like native assembly, but it’s not. This CIL is distributed to client/customer machines, and when the user starts the program, the .NET runtime environment that is already on the user’s computer is what actually runs, and then it reads the CIL and at that point, tells the processor what to do via native binary code. This process is called “JITTING”/”JITC” which stands for Just-In-Time Compilation. It is called this because the programmer’s code is compiled to native instructions for the CPU “just in time” for it to be run. Go figure.
The good news for reverse engineers is that turning CIL into .NET C# code is extremely easy, especially compared to turning native x86-64 assembly into C or C++. This is where ILSpy or dnSpy come in. I personally use ILSpy just because I haven’t seen a huge reason not to, but many people prefer dnSpy. Both of these “Spies” allow you to drag a C# or .NET program onto them and they take the CIL and construct C# code from it. Mind you, this C# code will not be exactly how the program author wrote it. As you may know, there are many ways to do things in each programming language, so ILSpy/dnSpy will write the C# code how they want to rather than exactly how it is written. Why? Because the original C# code is lost… It doesn’t even exist in the file at all since the file gets turned into CIL when the programmer hits the “build” button in Visual Studio.
Below is an example program which has been opened up in ILSpy. You will notice that it has properties, methods, classes, and if you’re a C# programmer, then you will find the types to be very familiar:
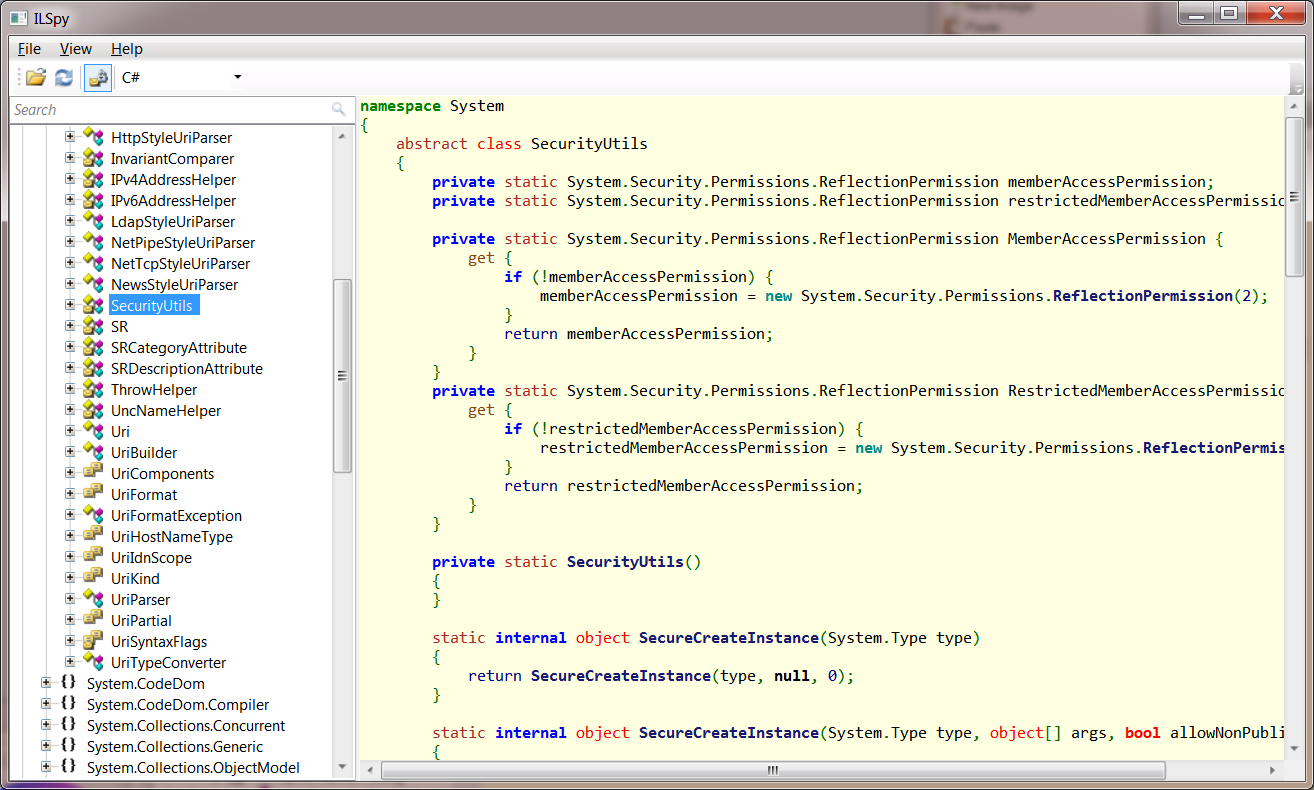
This photo is taken from http://ilspy.net/ , the official website.
The program is actually quite straightforward: you can use the tree on the left side to navigate the decompiled code. The only tip I have is to make sure you scroll down to the name of the actual application in the tree and open the subtypes from there, or you could get lost in the .NET boilerplate stuff. ILSpy and dnSpy both can also edit the program and save it back to disk. To do this, you just find code you want to modify, right click it, and click edit. See the below screenshot of this in dnSpy:
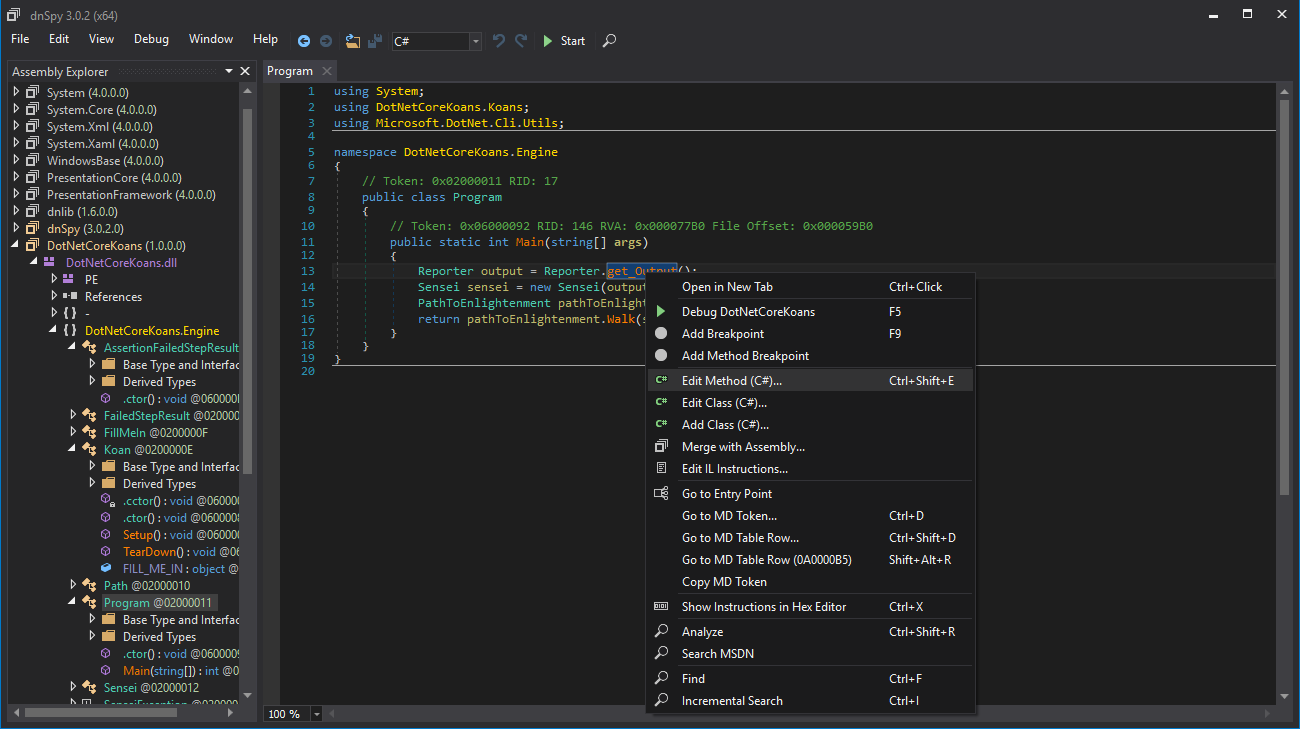
Editing a method in dnSpy is easy
To save your changes, you can just click the “Compile” or “Save” button.
To be frank, these two programs are probably a whole lot more powerful than what I’ve described here, but in my every day usage of them as a Malware Analyst, these features are pretty much all I use… Except for when a file is obfuscated. For this, see below de4dot.
de4dot
https://github.com/0xd4d/de4dot
Purpose: Once decompiled, if the .NET code you’ve decompiled looks like a bunch of strange numbers or gibberish code, you need this.
As long as it’s in CIL, .NET code is pretty easy to decompile. The only thing that some malware authors will do to make it tougher is “obfuscation.” All this means is that all of the types, methods, and properties are still there, but their names are gibberish. It is still possible to figure out the behavior of a program even when it’s obfuscated, but it’s like reading through really, really, really, poorly written code: it’s not fun. The better solution is to use a deobfuscator like de4dot! de4dot claims to be able to deobfuscate the code produced by the following obfuscators:
Agile.NET (aka CliSecure)
Babel.NET
CodeFort
CodeVeil
CodeWall
CryptoObfuscator
DeepSea Obfuscator
Dotfuscator
.NET Reactor
Eazfuscator.NET
Goliath.NET
ILProtector
MaxtoCode
MPRESS
Rummage
Skater.NET
SmartAssembly
Spices.Net
Xenocode
I was going to post a screenshot of what obfuscated code looks like, but I can’t find a sample at the moment. If you’re really curious, go to the website of one of those obfuscators or just wait until you get some obfuscated CIL, you’ll know 🙂
Using de4dot is quite easy, you just drag the file onto the de4dot icon. Also note that these obfuscator programs are often officially called “code protectors” or just “protectors.” Apparently the word has a better ring for the marketing folks.
Dynamic Analysis Tools
Sysinternals Suite\Process Explorer (procexp)
https://technet.microsoft.com/en-us/sysinternals/bb842062.aspx
Purpose: Much better version of “Task Manager” with many more options, the ability to examine handles and thread details, and other malware fighting utilities.
Process Explorer is part of Microsoft’s Windows Sysinternals Suite of tools. Simply put, it’s “task manager on steroids.” For malware analysis, it has a ton of useful features. For example, it has built-in methods to submit file hashes to VirusTotal.com and display the results, it can verify file authenticity certificates based off of files loaded in memory, it recognizes packed files and color-codes them, it allows for a delayed display to identify those annoying files which start, do bad things, then immediately exit before you can catch them in Task Manager, and it also can display when a process was started and it’s entire lifespan compared with other images loaded in memory. Process Explorer does a whole lot more than just this, but those features alone make the tool invaluable for dynamic malware analysis. See the screenshots below for some feature highlights:
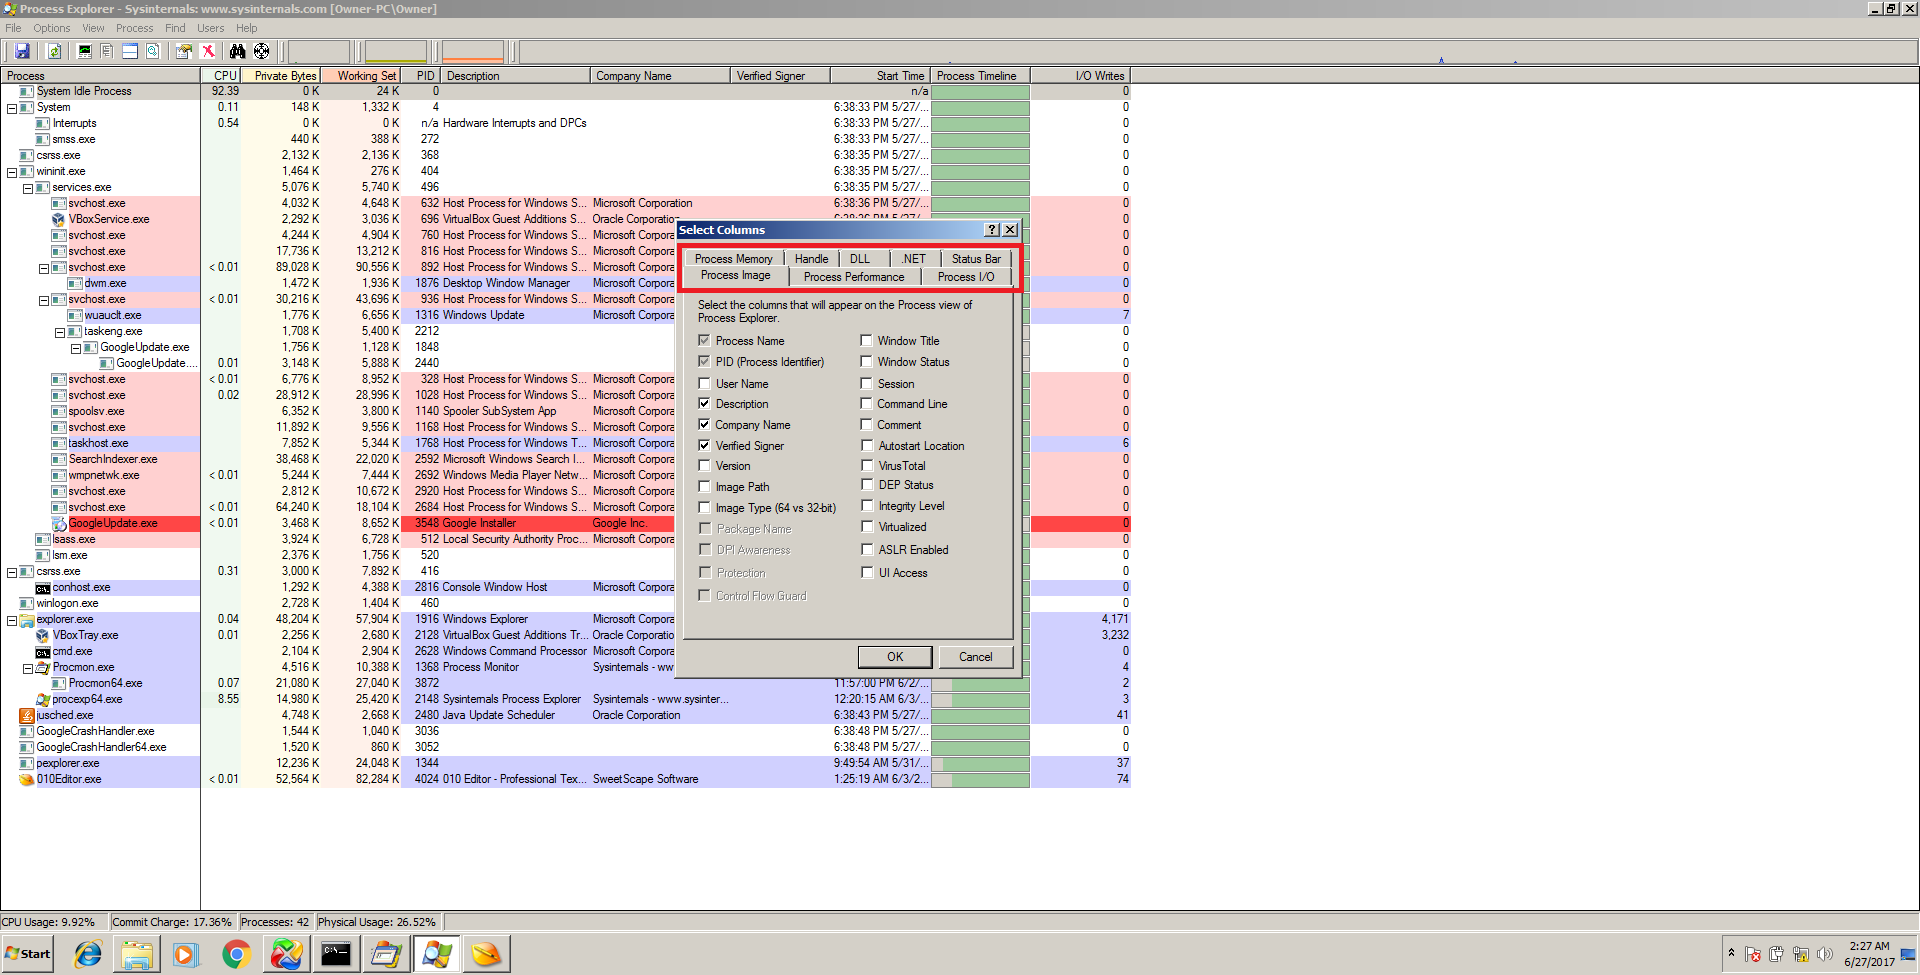
Note all of the tabs in this window. The tabs all contain options to customize what is shown for each process in the list. Also note the tree view of processes which display the parent/children, color coding, and bullseye icon at the top which allows to identify any given window it is dragged onto.
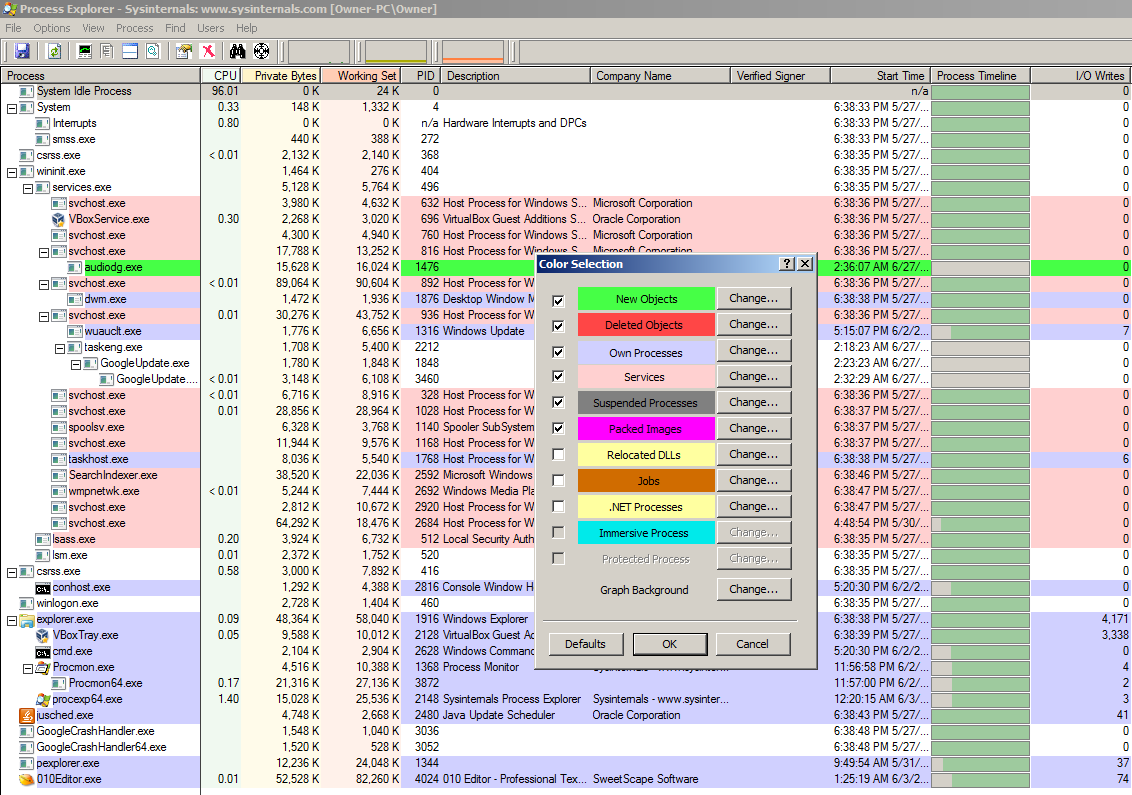
The colors can be customized and here are their default definitions.
Sysinternals Suite\Process Monitor (procmon)
https://technet.microsoft.com/en-us/sysinternals/bb842062.aspx
Remnux alternative: sysdig, unhide, ltrace, strace
Purpose: Log EVERYTHING that all programs do on the computer
Procmon is the ultimate basic dynamic malware killer. Procmon literally shows the analyst every single thing that every single program is doing. It records each action as an “event” and adds it to the log. As one would imagine, the log gets very big, very fast. For this reason, Procmon comes with a powerful filter which allows the analyst to easily isolate activity and analyze it. By being able to view spawned processes, all registry activity, and all file activity, an analyst can get a handle on nearly any program with ProcMon, as long as they are detail-oriented. In fact, the creator of the Sysinternals tools has a video on YouTube where he demonstrated that even advanced persistent threats like Stuxnet are quick work for ProcMon analysis.
Procmon also offers something called the process tree which is similar to Process Explorer except instead of a live view, it displays all process history that occurred while Procmon was open and monitoring, so it will display any child processes that a program launched as well. Very useful for those pesky programs which start and then exit in a fraction of a second. See the below screenshots for detailed explanation:
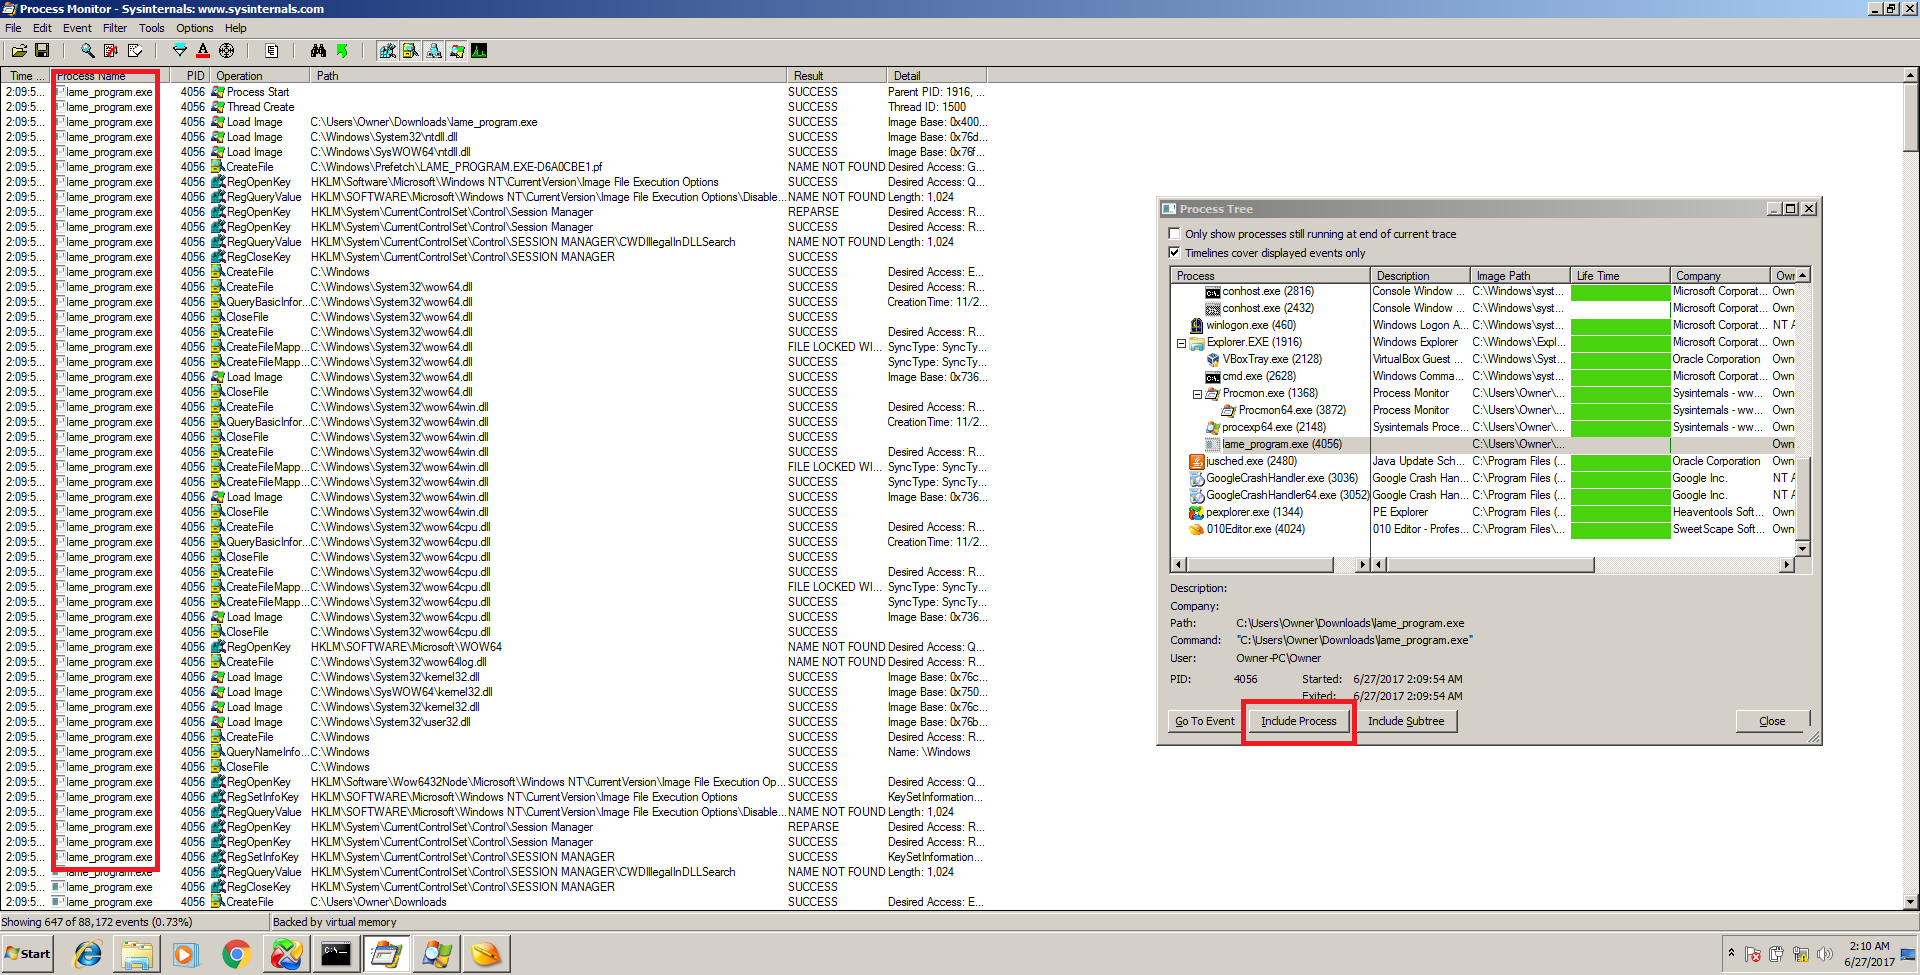
Pressing CTRL+T brings up the process tree where even processes which are no longer running can be tracked by “include process” which will filter out other results in the main window.
Pressing CTRL+L brings up the filter box which allows you to filter the giant log by almost any parameter you can imagine.
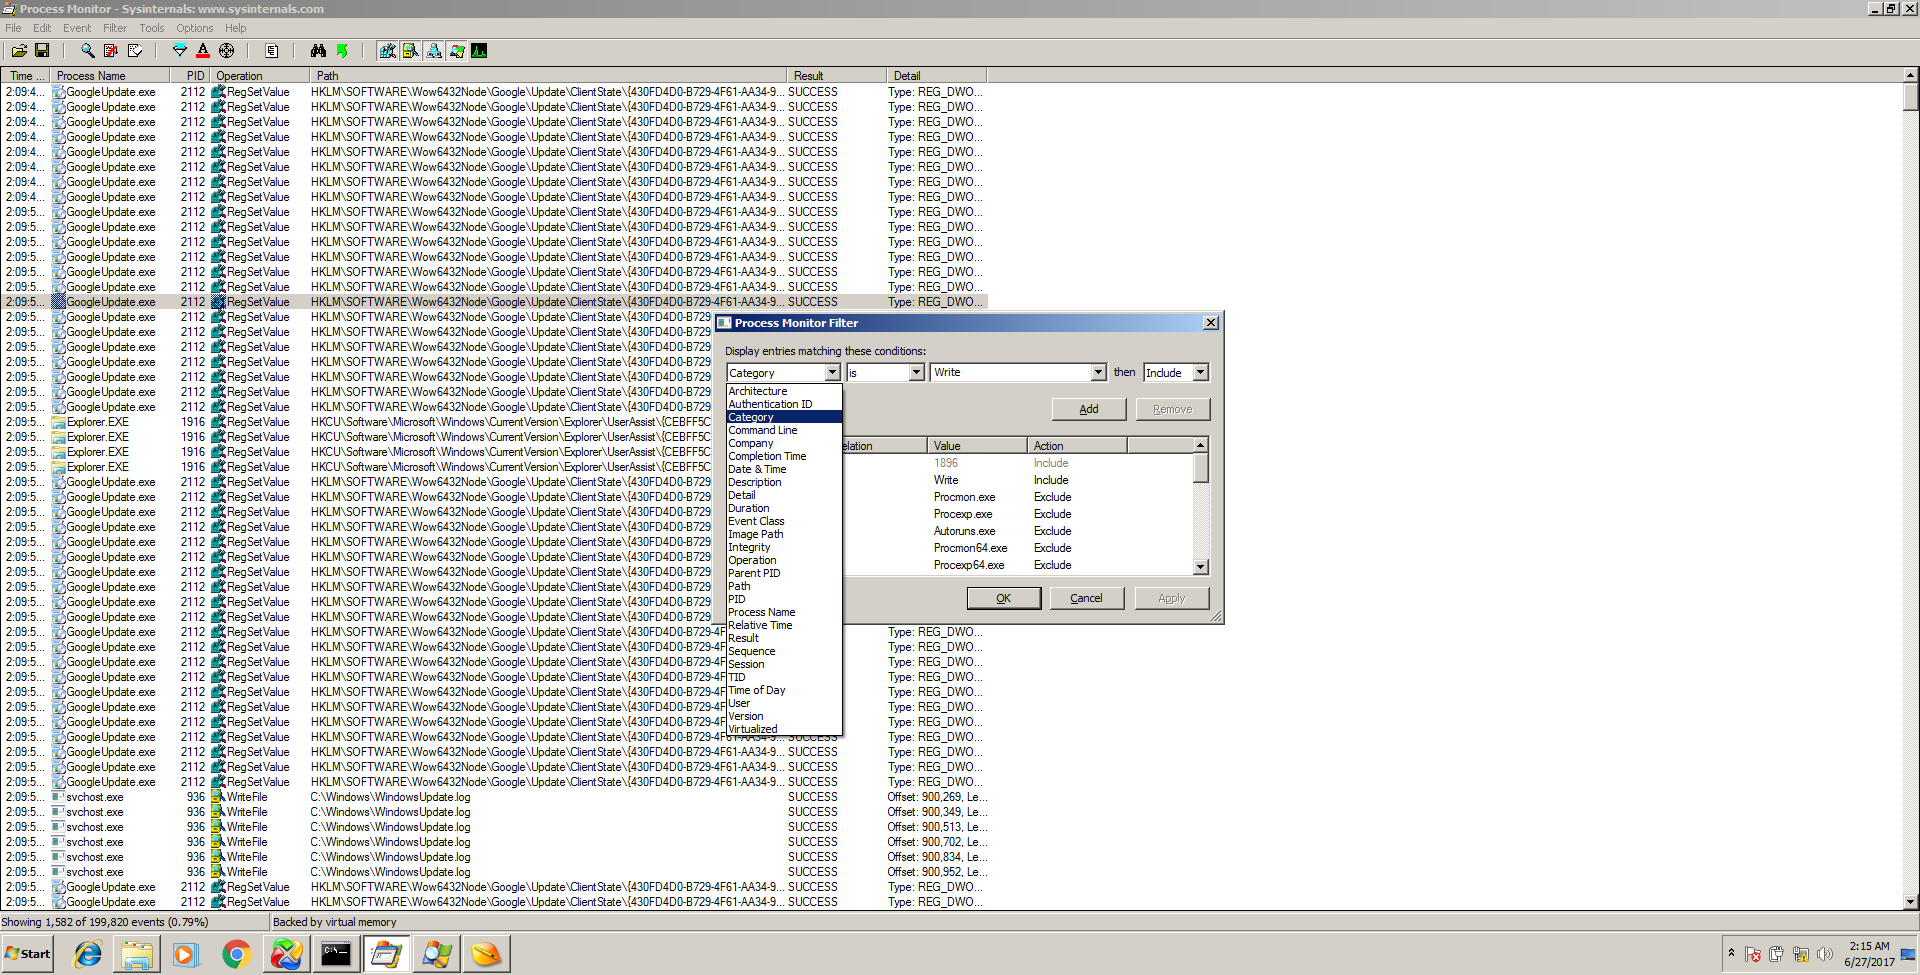
When used with some effective filtering, Procmon becomes one of the most useful tools for malware analysis period and perhaps the most useful tool for dynamic analysis. Malware often writes new files to the disk or values in the registry. Procmon will detect all of this by simply setting a filter for “Category is Write.” An analyst can easily narrow down the log first to a specific process or program, then by Category is Write and the malware behavior starts to become very obvious. There are tons more settings to play around with, but this info will get you started.
DEBUGGERS
Debuggers are so powerful that I wanted to include an entire dedicated subsection to them. By and large, if I had to choose only one tool for malware analysis for whatever reason, I would choose a debugger. Why? Because debuggers are the only tools which can technically perform everything needed to analyze malware. Static analysis can be a huge help as well, but cannot easily identify data which is programmed to be generated at runtime. For example, there could be complex functions which when ran, generate a 5 page essay, but when examined statically, the essay doesn’t exist. Well, once these functions are ran, the essay will then be in memory and readable by a debugger, either as one 5 page piece in the program’s address space or even one letter at a time inside of the CPU registers.
Debuggers can also defeat all of the most advanced tactics that malware authors use to try and thwart analysis such as using packers/compression, even custom-built packing. This is because they give an analyst direct control over the program’s execution so with enough practice, experience, and training, an analyst can simply change values about memory, jump around the program, and defeat anything in his or her path. Of course, there are anti-debug techniques that malware authors will try to use, which are detailed in this paper by Peter Ferrie, but every single technique can also be avoided with some training and/or using the right plugins with your debugger of choice. A video series of how to unpack an executable can be viewed below by Karsten Hahn:
Adding even more to the already powerful debugger’s capabilities is their ability to not just modify loaded memory instantly, but then save those changes back onto the drive as an executable, much like a regular hex editor but since the analyst is viewing the data as disassembly and in real-time execution, it’s arguably even more powerful. In fact, this is often how software was “cracked.” All a cracker had to do was open up a program in a debugger, find the location whichs checks for a CD key or password and either bypass it by placing a “JMP” assembly instruction over that area, or just changing the logic to fulfill the requirement in some other way, then re-saving the modified program to disk. This same philosophy can be applied to malware analysis to tamper with and learn about malware, as well as step over, for example, virtual machine detection mechanisms or other anti-analysis techniques.
Okay, let’s get into the specific debuggers now.
OllyDbg and x64Dbg
OllyDbg: http://www.ollydbg.de/
x64Dbg/x32Dbg: http://x64dbg.com/
Remnux alternative: Evan’s Debbuger (edb)
These two programs are so similar that I am putting them into the same section. They both share most features and even use many of the same hotkeys. You can think of x64Dbg as an updated OllyDbg but definitely not as widely known yet. As the name suggests, X64Dbg does support x86-64 files instead of only 32 bit files, unlike OllyDbg. In case you’re wondering, x64Dbg also comes with “X32Dbg” which, like OllyDbg, also supports 32 bit files. I’ve found that the x64Dbg interface is nicer and maintained but OllyDbg being the original and most widely known, has the most and the best plugins.
OllyDbg and x64Dbg are both assembly-level user-space debuggers. This just means that unlike other debuggers in other IDEs, these debuggers work exclusively at the machine-code/assembly level. Due to this fact, they can be used on any executable file, even without the source-code or an IDE and in fact are quite lightweight programs. These programs work by loading the actual malware file into memory just like when it is run, and then pausing its execution at an instruction and allowing the analyst the examine each instruction which is actively loaded into memory, stepping through each one, observing changes, and even modifying the program in real-time. For example, using one of these tools, an analyst could locate the text for a dialog box in a program which is actively running and change that text instantly from inside the debugger without doing anything else in the program that is running. In addition to data modification like this, assembly instructions can be added, removed, or modified.
However, the most useful purposes of debuggers for malware analysis are decryption, unpacking, and resolving other runtime data. For example, one of the things that PE Studio or other static analysis tools can do is look for strings. However, what if the string is not present in the file at all on disk but it contains a function which creates the string after the program is running? By doing this, malware can evade easy static analysis. However, when the malware is run in a debugger, this string will eventually be created by the function and placed in memory in a spot viewable by x64 or OllyDbg. To speed up the process, static and dynamic debugging techniques can be combined. For example, an analyst may locate what appears to be some sort of function that will generate a string at runtime using a static analysis tool and then paste the memory address found during static analysis in a tool such as IDA Pro or Binary Ninja into OllyDbg or x64Dbg. Now, the program will be running and a breakpoint can be set so that when the memory address is reached, the program will stop and the CPU registers and memory can be examined to view the string once it is produced by the function which was found in static analysis.
This above fact holds true also even for encryption and compression; even though a proper encryption algorithm is used, an analyst can use a debugger to pause the program at the right moment when an encryption key is exposed or just allow the program to first decrypt the encrypted information and then pause execution. At this point, the decrypted data is sitting in memory and can then be “dumped” (saved) down into a file on disk and further analyzed by other tools. This is the reason why any time someone has access to a machine that is performing encryption, it is never truly a secured process. This is also true for compression (also called “packing”). A file can be manually unpacked with a debugger in a similar way as I described decrypting data above.
I also mentioned that these tools are user-space debuggers. This means that they cannot debug programs running in kernel-space like device drivers and the Windows Kernel. For this, you need a kernel-space debugger such as WinDbg, as well as a separate machine because if the Kernel is stopped, that means the machine can’t actually function and therefore it cannot debug itself. In a user-space debugger, the machine itself doesn’t actually pause, the kernel just pauses the specific program being debugged. It is possible for malware to run in kernel-space, though most does run in user-space.
As aforementioned, debugger training is out of the scope of this guide and tutorials can be found on http://tuts4you.com as well as YouTube. However, I will still show some screenshots of these tools:
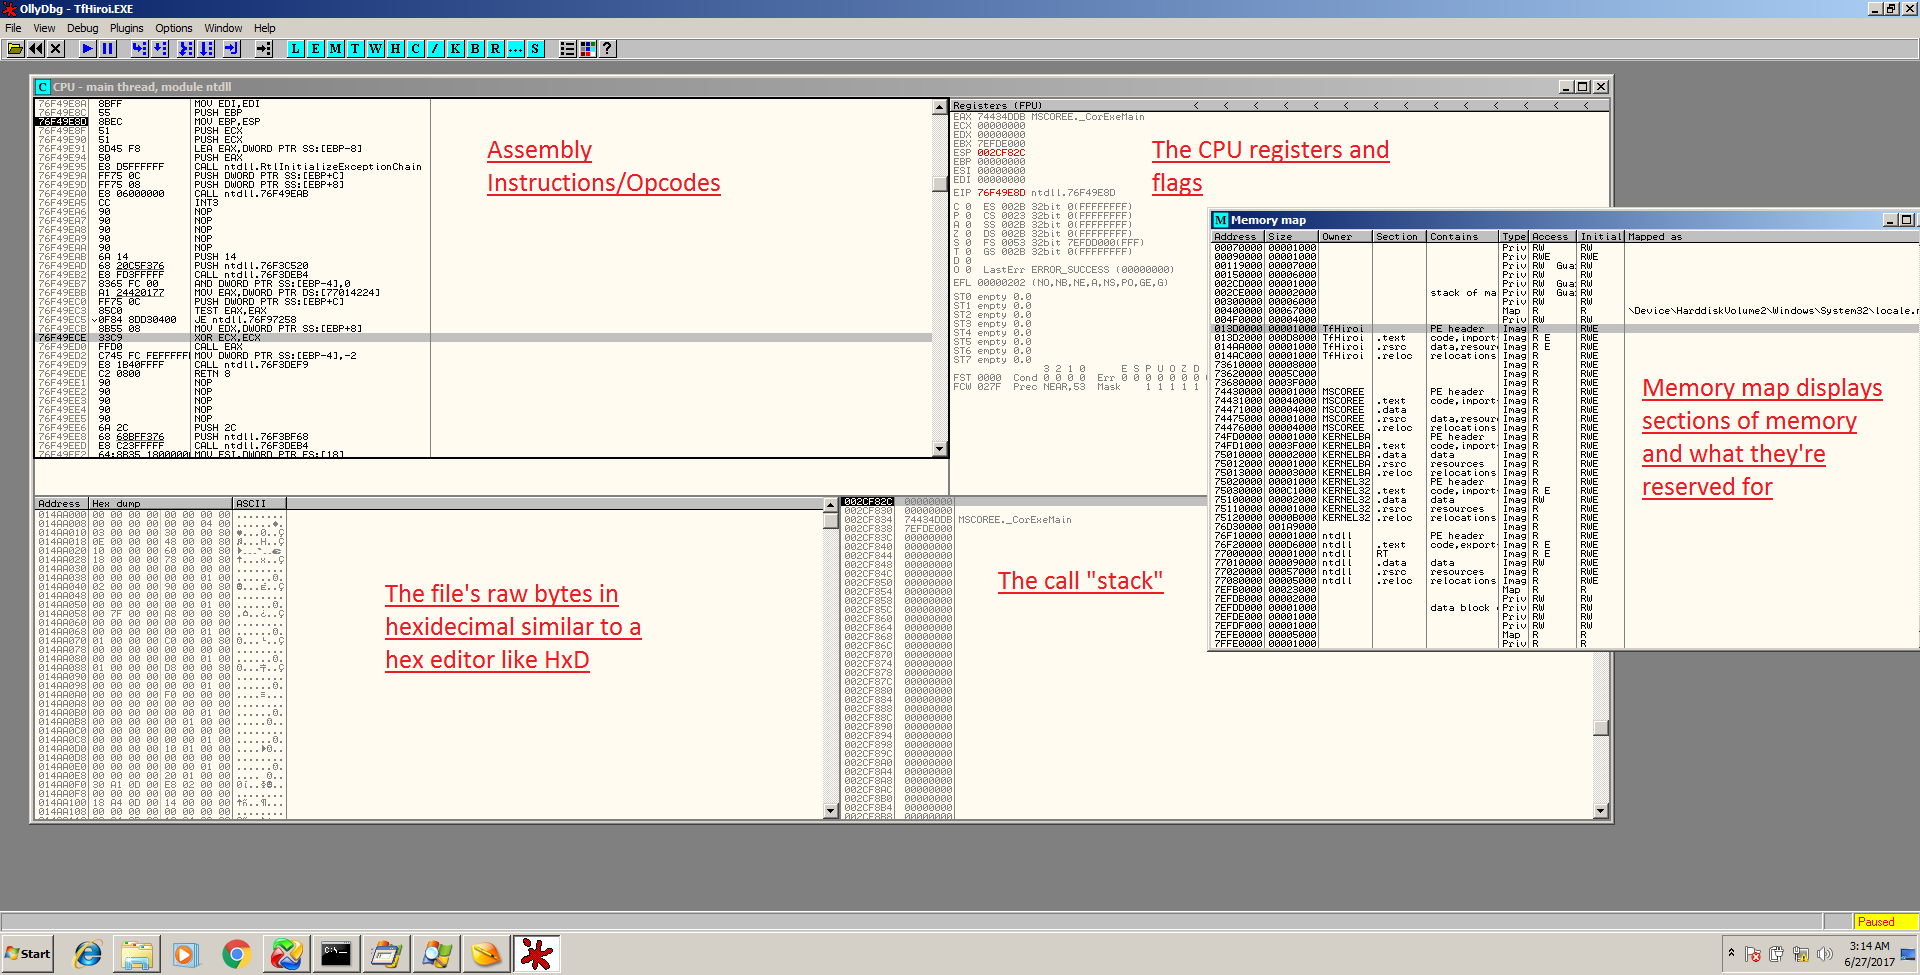
Clicking the “M” on the toolbar brings up the Memory Map which is slightly similar to the static PE analysis tools except for a running program.

Notice the same layout as OllyDbg except just more feature-rich.
I did not label X64Dbg because the layout is the exact same as OllyDbg and should look familiar, except with more tabs for extra features which are self-explanatory. In either of these debuggers, you can right-click on any instruction, CPU register, or hex value to edit it and click OK to see immediate changes.
GNU Debugger (GDB)
https://www.gnu.org/software/gdb/
Remnux alternative: Comes with Remnux pre-installed
The GNU Debugger (GDB) is an extremely powerful and popular debugger which has a different style from the previous GUI-based debuggers. This debugger is used by C programmers, reverse engineers, and security researchers alike. This is a command-line based debugger in which you open the file in question and can review disassembly, code with debug symbols, place breakpoints, and step through the program just like the other debuggers. GDB also supports “examining” values with commands such as x/32x 0x80484d0 which means “examine the next 30 bytes starting at memory address 0x80484d0.” Also note that you must use forward slashes in gdb with the commands since it was made for a Linux environment and that is the norm.
I love GDB for 3 reasons:
- It’s very lightweight and is available on both Linux and Windows. It is primarily a Linux tool but can also be installed via MinGW or Cygwin. It is still a very powerful debugger on Windows systems as well and can be used from the command prompt just like the Linux terminal.
- It’s barebones and it “just works.” If I get frustrated with the bloat, speed, or problems of other debuggers, I run back to GDB.
- The development of the tool is very mature and thus it is well known and supported. There are also some cool 3rd-party extensions, such as gdb-peda.
Here is a screenshot of gdb in action using the “list” and examine commands:
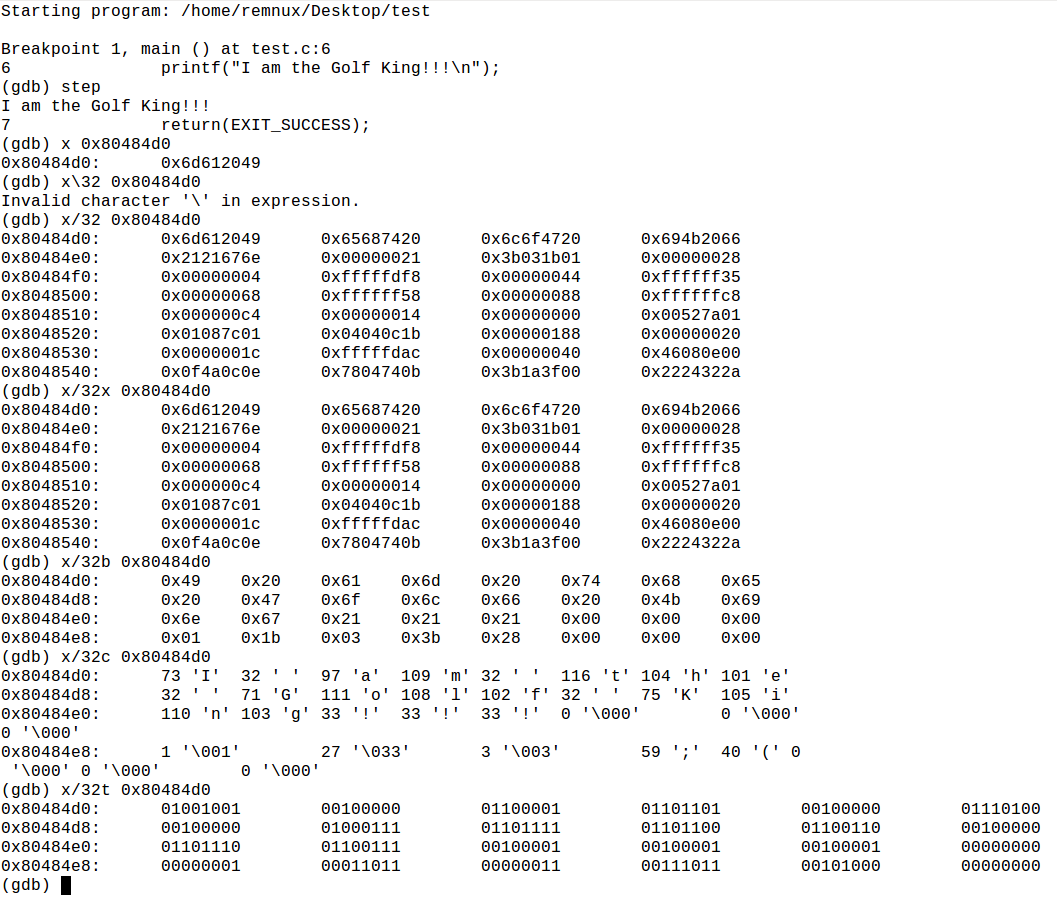
Here, using gdb, we see that a string is simply an array of adjacent memory addresses holding 1 char each, followed by a 0 to terminate it
If gdb confuses you, I recommend you pick up the book called Hacking: The Art of Exploitation Second Edition by Erickson. The book goes over how to use GDB in a concise and thorough manner.
IDA PRO
http://www.hex-rays.com
Remnux Alternative: radare2 (IDA Pro is available for Linux, but it’s not free)
Special Note*: IDA Pro is both a static disassembler, decompiler, and a debugger. I’ve decided to place it down here with the other killer debuggers but it can fit any of these categories.
This is the grandmaster of all static reverse engineering tools when it comes to native applications; and by that I mean non-VM and non-interpreted. IDA is not the best for .NET, Java, Python, etc… There are better tools for those which we will go over below.
Simply put, IDA Pro takes a file consisting entirely of machine code and turns it into human-readable assembly code. This makes it a disassembler by definition, but it’s a much nicer disassembler than you’d be used to coming from gdb or another debugger, for example. This is because IDA Pro does a bunch of extra work for you. When a file is opened in IDA, IDA tries to do the following:
- Determine the processor architecture that the opcodes are written for
- Parse the instructions into assembly
- Determine the program’s entry-point
- Try to locate “main”
- Give preliminary names to various locations where execution jumps around to
- Give preliminary names to functions/routines
- Locate strings in the file
- Figures out via context and constants which function calls are OS or system API calls, and labels them appropriately*
- A whole lot more
*This is when they are called in a locatable fashion. For example, if the program author places a function address into another memory address, then places that memory address (which is a ptr at this point) and then 1500 lines later into a register like eax and calls eax, IDA may not alert you at the spot where it’s called which API is being used. However, it will tell you at the spot where the OS API function is initially loaded into the pointer address.
This is all just the initial assessment/opening of the file. IDA Pro is powerful not just because it does all of the above, but it also creates a visual control flow graph (CFG) which looks like this:
This graph makes it much easier for a human to follow the control flow of an assembly program than just staring at a linear list of instructions. This is because assembly programs have tons of jumps to different memory addresses, which can get very difficult to follow very fast. The CFG is very intuitive, especially for decision-making if statements and loops too. This CFG, the automatic recognition of OS and system API calls, and the ability to customize the GUI are probably the biggest selling point that set IDA Pro apart from the competition. Some other useful features of IDA include:
- Full-featured search functions allowing for text and byte searching through an application
- Direct viewing of the non-code section of the file such as the .data and .rdata sections. This is
- very helpful
- Functions and “Names” lists which isolate all of the functions or other important points in a program and with a simple click, IDA will take you to the area of the code where the function or label appears
- Automation/scripting capabilities using a C-like language called IDC or a Python-like language called IDAPython. Scripting allows an analyst to perform automated tasks such as searching for and locating common encryption constants or performing automated analysis of code/data patterns
- IDA allows you to define structs in a program. This is useful because there may what appears to be an unknown struct. For example, a group of adjacent words and dwords that are referenced by offsets on a repeated basis may indicate a struct. You can define this so that the group of data is easier to keep track of rather than trying to memorize all of the offets which look like dword ptr [eax+2C] for example.
- IDA also comes with a full debugger, allowing you to do typical debugger things like placing breakpoints and examining memory. This is also compatible with scripting which is very useful
- The last big feature I will mention is you can purchase (for a lot of money) a plugin called Hex-Rays Decompiler, which allows the analyst to turn the disassembly code into C code. This can be helpful when trying to understand groups of more complex disassembly, disassembly which does not use many labeled OS API calls, or otherwise get a higher-level view of a module of the malware. I personally am not a big fan because I find cryptic C code which it creates to not be much more helpful than the disassembly, but it has its uses
- They have a limited time frame to analyze the software. This means that if a program is set to do malicious things in for example, 10 minutes (or even 2-3 minutes) after it starts running, these things will probably not be observed. Some of these hybrid tools try to stop this by dynamically intercepting thread sleeps and turning them down to 0 or some other small number of seconds, but this is not always successful. The tools can also indicate the fact that the subject program is delaying execution to also help identify this behavior.
- If they can’t run the software, they aren’t much help. The effectiveness of these tools gets tremendously hampered if the malware is programmed to behave differently when running in a virtualized environment, or for example, there is just a legitimate error with the analysis machine which prevents the malware from running at all. In these cases, only the static analysis info will be present which is not much better than simply running strings on the file. This occurs more often than you would think… Much more often.. This is why I prefer my own lab because I can mess with the file and try to get it running fast.
- Reversing Windows malware on Linux is generally safer. This is because binaries designed to run on Windows won’t run on Linux and vice-versa; so if somehow you accidentally attempted to run malware on your actual host machine or it was able to escape from the virtual machine lab, you’d be safe.
- They’re all free and open-source. This is not the case with several of the Windows tools mentioned above. However, I’ve noticed that some of the paid tools are also higher quality and better maintained because the authors are actually making a living, or at least a partial living, off of them
- Some of the Remnux tools which are niche, such as searching for and cracking xor encoding, and examining PDF/doc files, I find to be better and safer in a Linux environment. When I use Remnux, it’s usually involving xor encoding work or examining malicious document files.
- Those who prefer Linux and are at home using it will be happy to know that this distro has a ton of Windows PE malware tools
for finding shellcode, and in fact IDA allows you to highlight bytes in the data segment and turn them into assembly code with the click of a button. This is good for when malware hides shellcode or assembly instructions inside of a non-code section of the file
That’s all for IDA Pro. The program is huge and has its own book in fact, which I highly recommend purchasing if you are going to use IDA. It is called IDA Pro Book by Chris Eagle.
in this paper
Hybrid Tools
Hybrid Malware Analysis tools combine one or more of the above programs and/or techniques into one big report. This means that you give the tool a file as input and then it runs basic static and basic dynamic analysis on it. A hybrid tool cannot really perform “advanced analysis” because the definition of that is having a human open up the file in a disassembler and/or debugger and manually examine the functionality. The closest a hybrid tool can come to advanced analysis is when automated scripts hand-crafted by analysts are run over the file. Nevertheless, a hybrid tool can run the file, take screenshots, show reports of the file’s behavior taken from ProcMon and Process Explorer, for example, and more. Using a hybrid tool can sometimes be a great indicator on whether a file is malware or not. However, these tools make many mistakes, miss bad files, and they also sometimes identify perfectly legitimate files as malware. As with any other type of “one-size-fits-all” tool, what we gain in diversity can be lost in quality in any one given area. However, in order to classify a malware sample, often getting small details from several different reports is sufficient, which is why there is a market for these types of tools.
Cuckoo Sandbox
Open-Source software you can install: https://www.cuckoosandbox.org/
As a service for immediate usage online: https://www.malwr.com
Probably the most popular option out right now is Cuckoo Sandbox. Since I described what these tools do above, I’m going to post screenshots to actually show you sample output because there is nothing new here:
Results from different AV engines
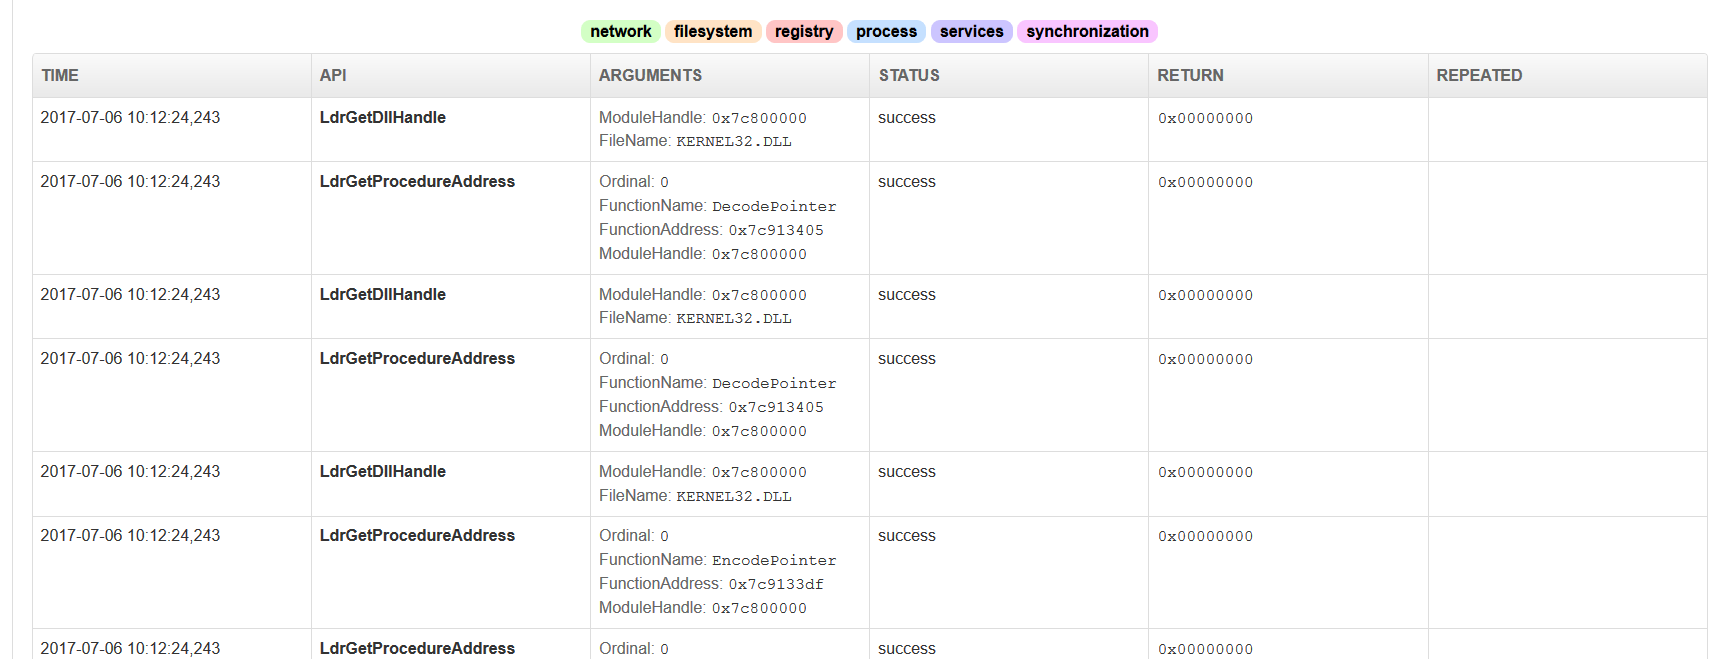
Behavioral analysis shows symbols/functions called by the application
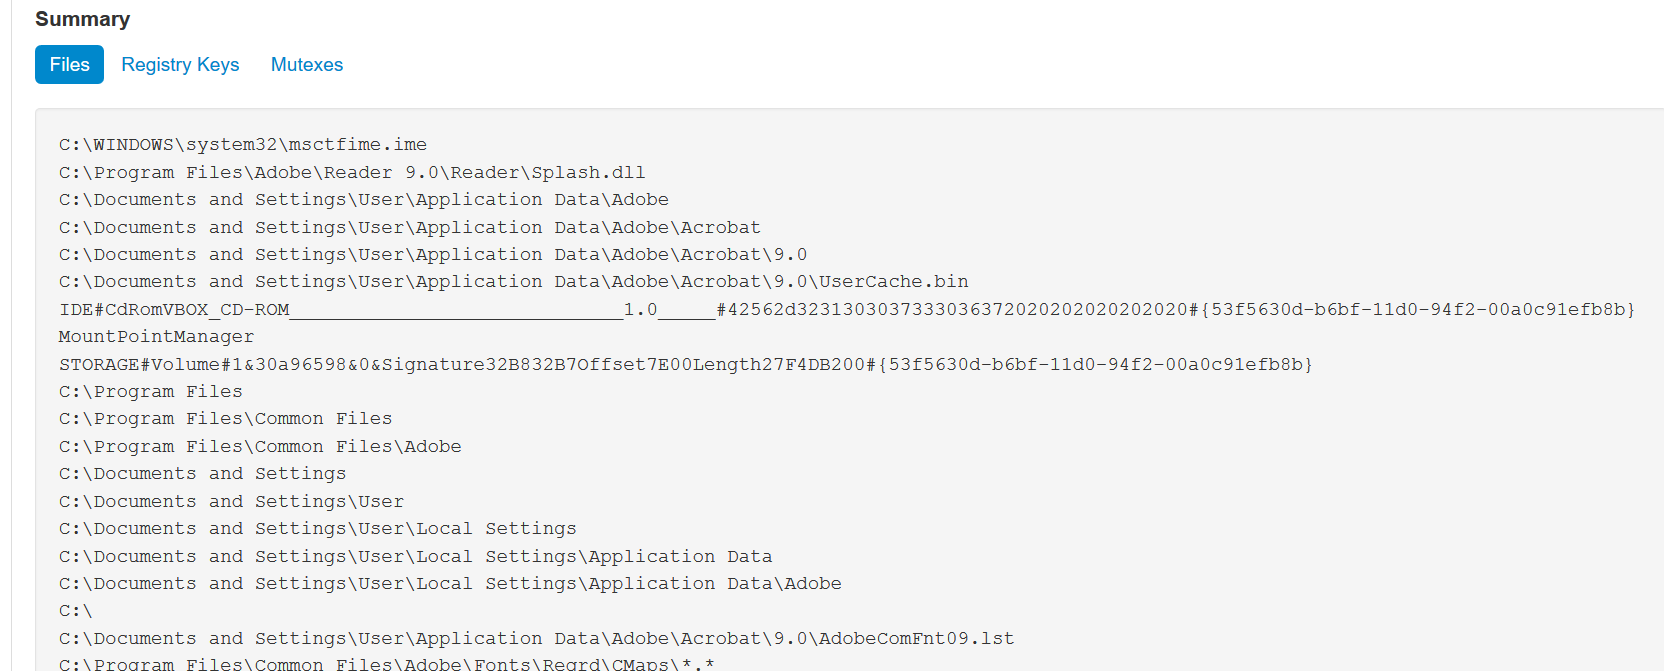
File activity observed by Cuckoo Sandbox
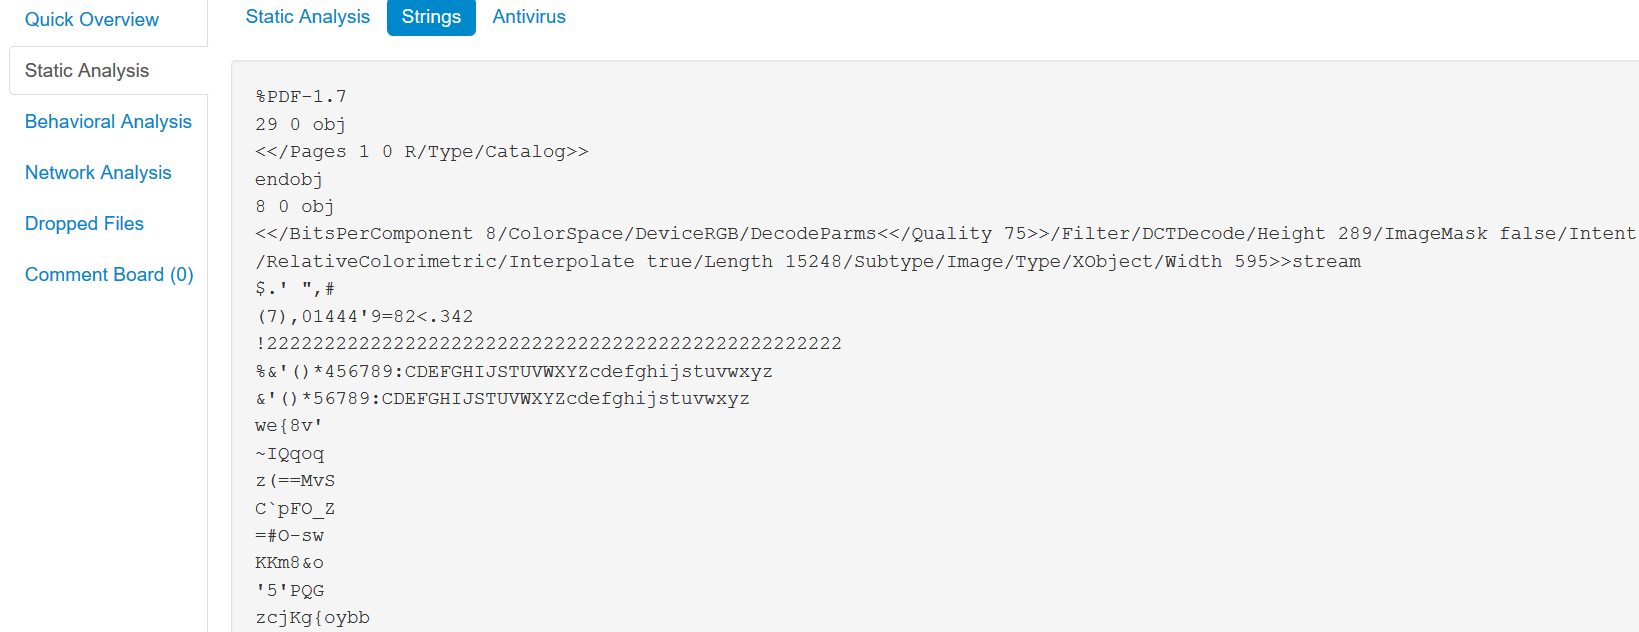
And your standard strings… Often the most useful bit of info
As we see above in the screenshots, another useful feature of Cuckoo is its parsing of API calls, including even the Image Loader calls which start with Ldr. Cuckoo has an alpha feature which attempts to flag and rate suspicious activity… But let me tell you, it’s absolutely an alpha feature and should not be relied upon at this point. I’ve seen it throw false positives as well as mark ransomware as good to go. Here’s a shot of some of that functionality, along with the screenshot page:
VxStream Sandbox/Hybrid Analysis
Purchase the software: https://www.vxstream-sandbox.com/
Free online usage: https://hybrid-analysis.com
Another big boy in the game is called VxStream Sandbox but it’s a bit different from Cuckoo in terms of licensing. VxStream is not open-source software like Cuckoo is, and it is developed and owned by a company called Payload Security. Payload Security sells VxStream as a software for analysts to purchase and install on their own machines or alternatively, they offer a partially-free online service, similar to malwr.com for Cuckoo, called https://hybrid-analysis.com . Hybrid-Analysis has certain limitations that would make anyone who needed to hammer on the service all day long want to purchase the full version. For example, there is quite a long delay for the results, result-sets have blocked-out results which are paid-only, and analysts are limited to 32 bit Windows 7 whereas the full version can also analyze 64 bit malware.
The “premium quality” does show though. In my opinion, Hybrid-Analysis is more comprehensive and accurate than Cuckoo Sandbox, even in free use mode; especially in terms of the scoring. They also have a whitelist they maintain of files which may be marked bad but are known good.
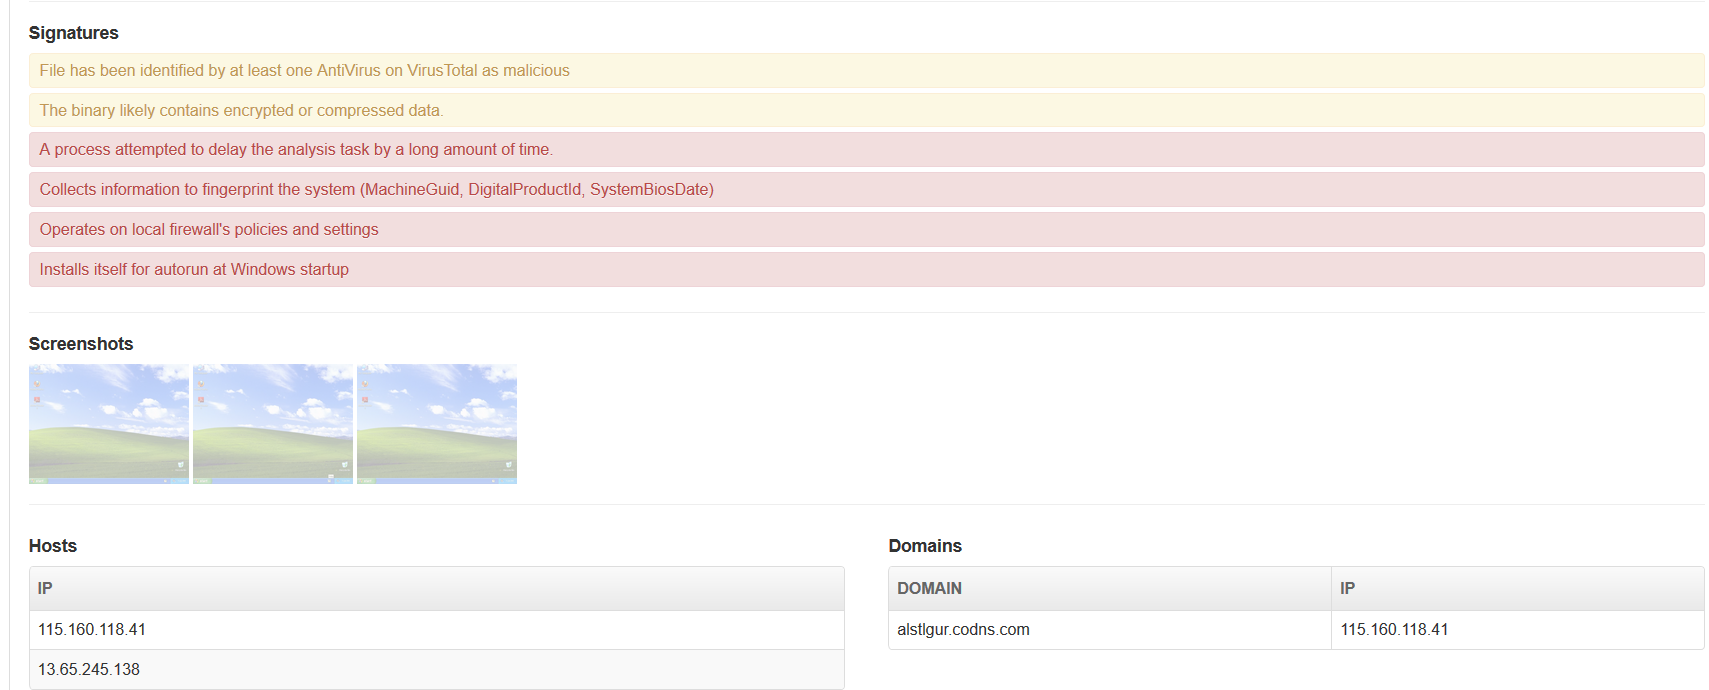
Here are some screenshots of VxStream in action on the PetyaWrap malware:
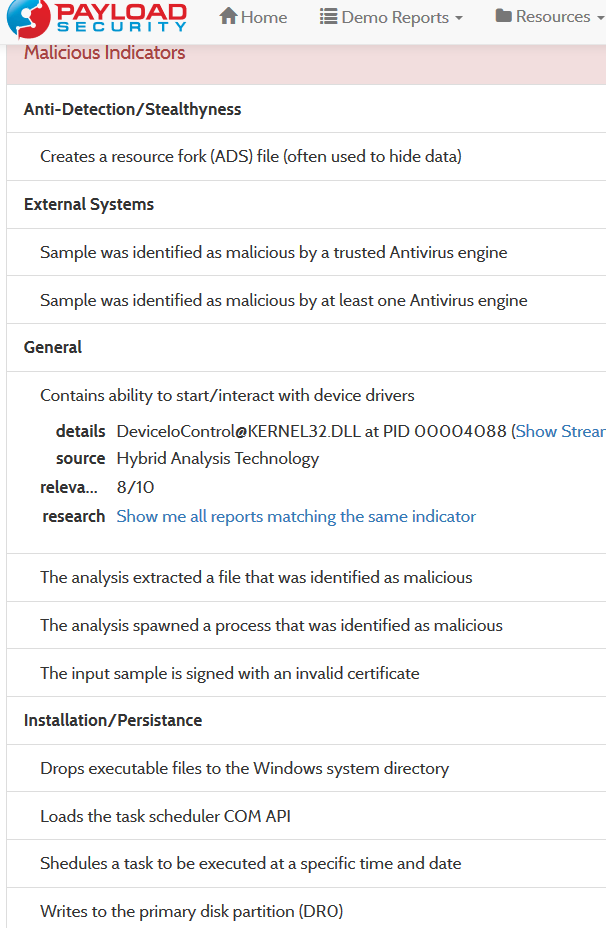
General report format. Each listings expands to details
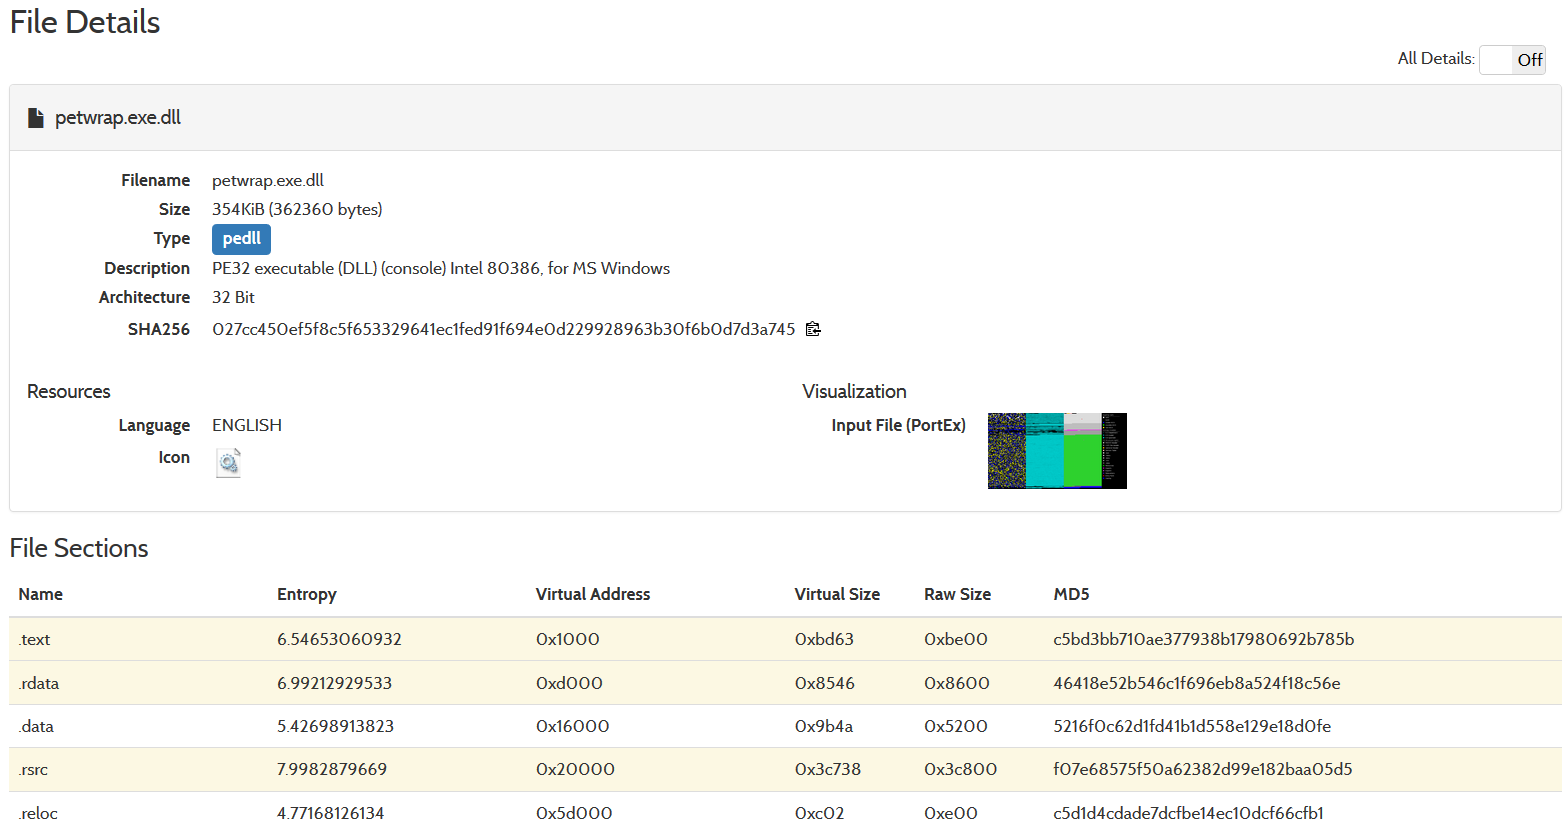
Hybrid Analysis even includes a PortEx Analyzer entropy image!

They call it “Hybrid Analysis” but it’s really a process tree equivalent to going into ProcMon and pressing CTRL+T. Still very useful feature
Hybrid-Analysis also sometimes maps out network activity on a world-map which is neat. I didn’t show network activity here because it frankly isn’t all that exciting but these tools also show packet captures similar to WireShark which occurred while the assessments were being done.
FireEye AX
I have not used FireEye AX but I’ve heard that this is another type of hybrid analysis platform similar to the above, except it is not free and actually costs a pretty penny. If anyone has access to this tool and would like to demo it to me for review, I’d be happy to do so.
Problems and Limitations with Hybrid Tools
There are some inherent problems with these tools which are worth mentioning:
Remnux
https://remnux.org/
Purpose: Operating system (Ubuntu Linux distro) which comes with a bunch of malware analysis tools pre-installed and is overall geared toward reverse engineering malware.
Remnux is basically just Ubuntu Linux with a bunch of malware/binary reversing tools. Some of the tools that come with Remnux have been covered above already. Frankly, I’ve found that the Windows tools that I’ve highlighted above are the best. However, the Remnux tools do have key advantages:
One thing that I’d like to see though, is more Linux malware tools. It seems most of the Remnux tools are actually geared towards analyzing Windows malware. This is no surprise, seeing as Windows malware is by far the most prevalent, but still, more ELF tools would be sweet.
Note: I’ve included Linux alternatives in the above programs because I’ve found that the functionality of most of the Remnux tools is so close to the Windows ones, that there is no point in doing a completely separate section on each one. However, I will be covering the Remnux tools which do not have a Windows counterpart above in this section.
Let’s take a look at some of the useful tools. For a full list, I recommend this one, which comes with Remnux. Note that this sheet is an html file but that link will take you to the GitHub source file for it. This means, you need to download it or copy/paste the code into a .html document and then open it into a browser to view it. I prefer this sheet because it also gives the terminal names of each application for easy running.
Signsrch
Signsrch is an extremely helpful utility that searches a file for known constants and signatures of cryptography and then identifies the locations in memory that they appear. This is a great way to locate the crypto functionality of malware and then go to the location in a disassembler or debugger. This program is also available as a plugin inside IDA Pro so it’s not necessary to use it as a standalone app if you don’t want. See the below output:
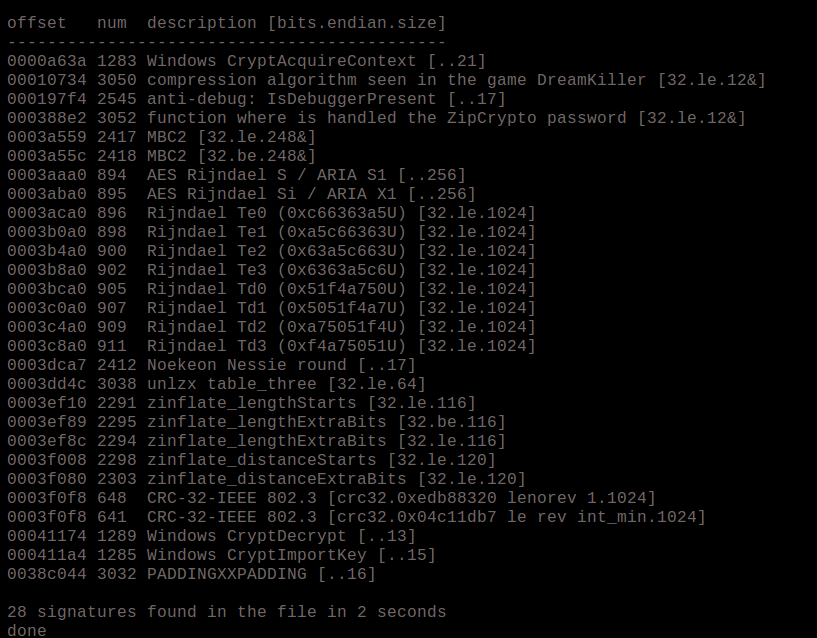
Signatures found in WanaCry
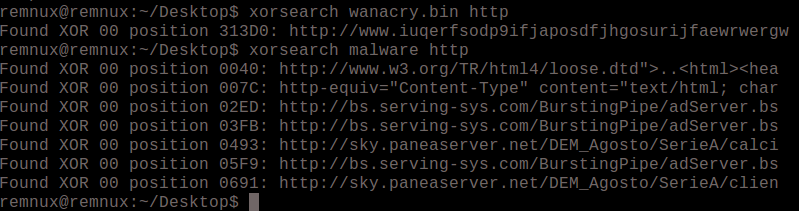
XORSearch
This program will take a string and try different XOR encoding keys on it in an attempt to locate concealed strings in the file. The limitation here is that you must provide a string as input so it’s not necessarily going to find strings that you do not know but it can be contrived to do so. For example, you can search a file for a generic string like “http” and find an entire URL from it because it will automatically finish out the rest of the adjacent bytes. See sample input/output below. I didn’t happen to have malware with a special key handy, but the only difference would be the output would have a different key in place of “00” which just means a plain string which was not xor encoded.
Future coverage (in no specific order):